Report 190
By Donald G. Jorgensen, U.S. Geological Survey | February 1975 (second printing August 1975)
Note: The oversize fold out map figures below were scanned separately from the report, so "missing pages" are these figures.
- Report 190 - Analog-Model Studies of Ground-Water Hydrology in the Houston District, Texas
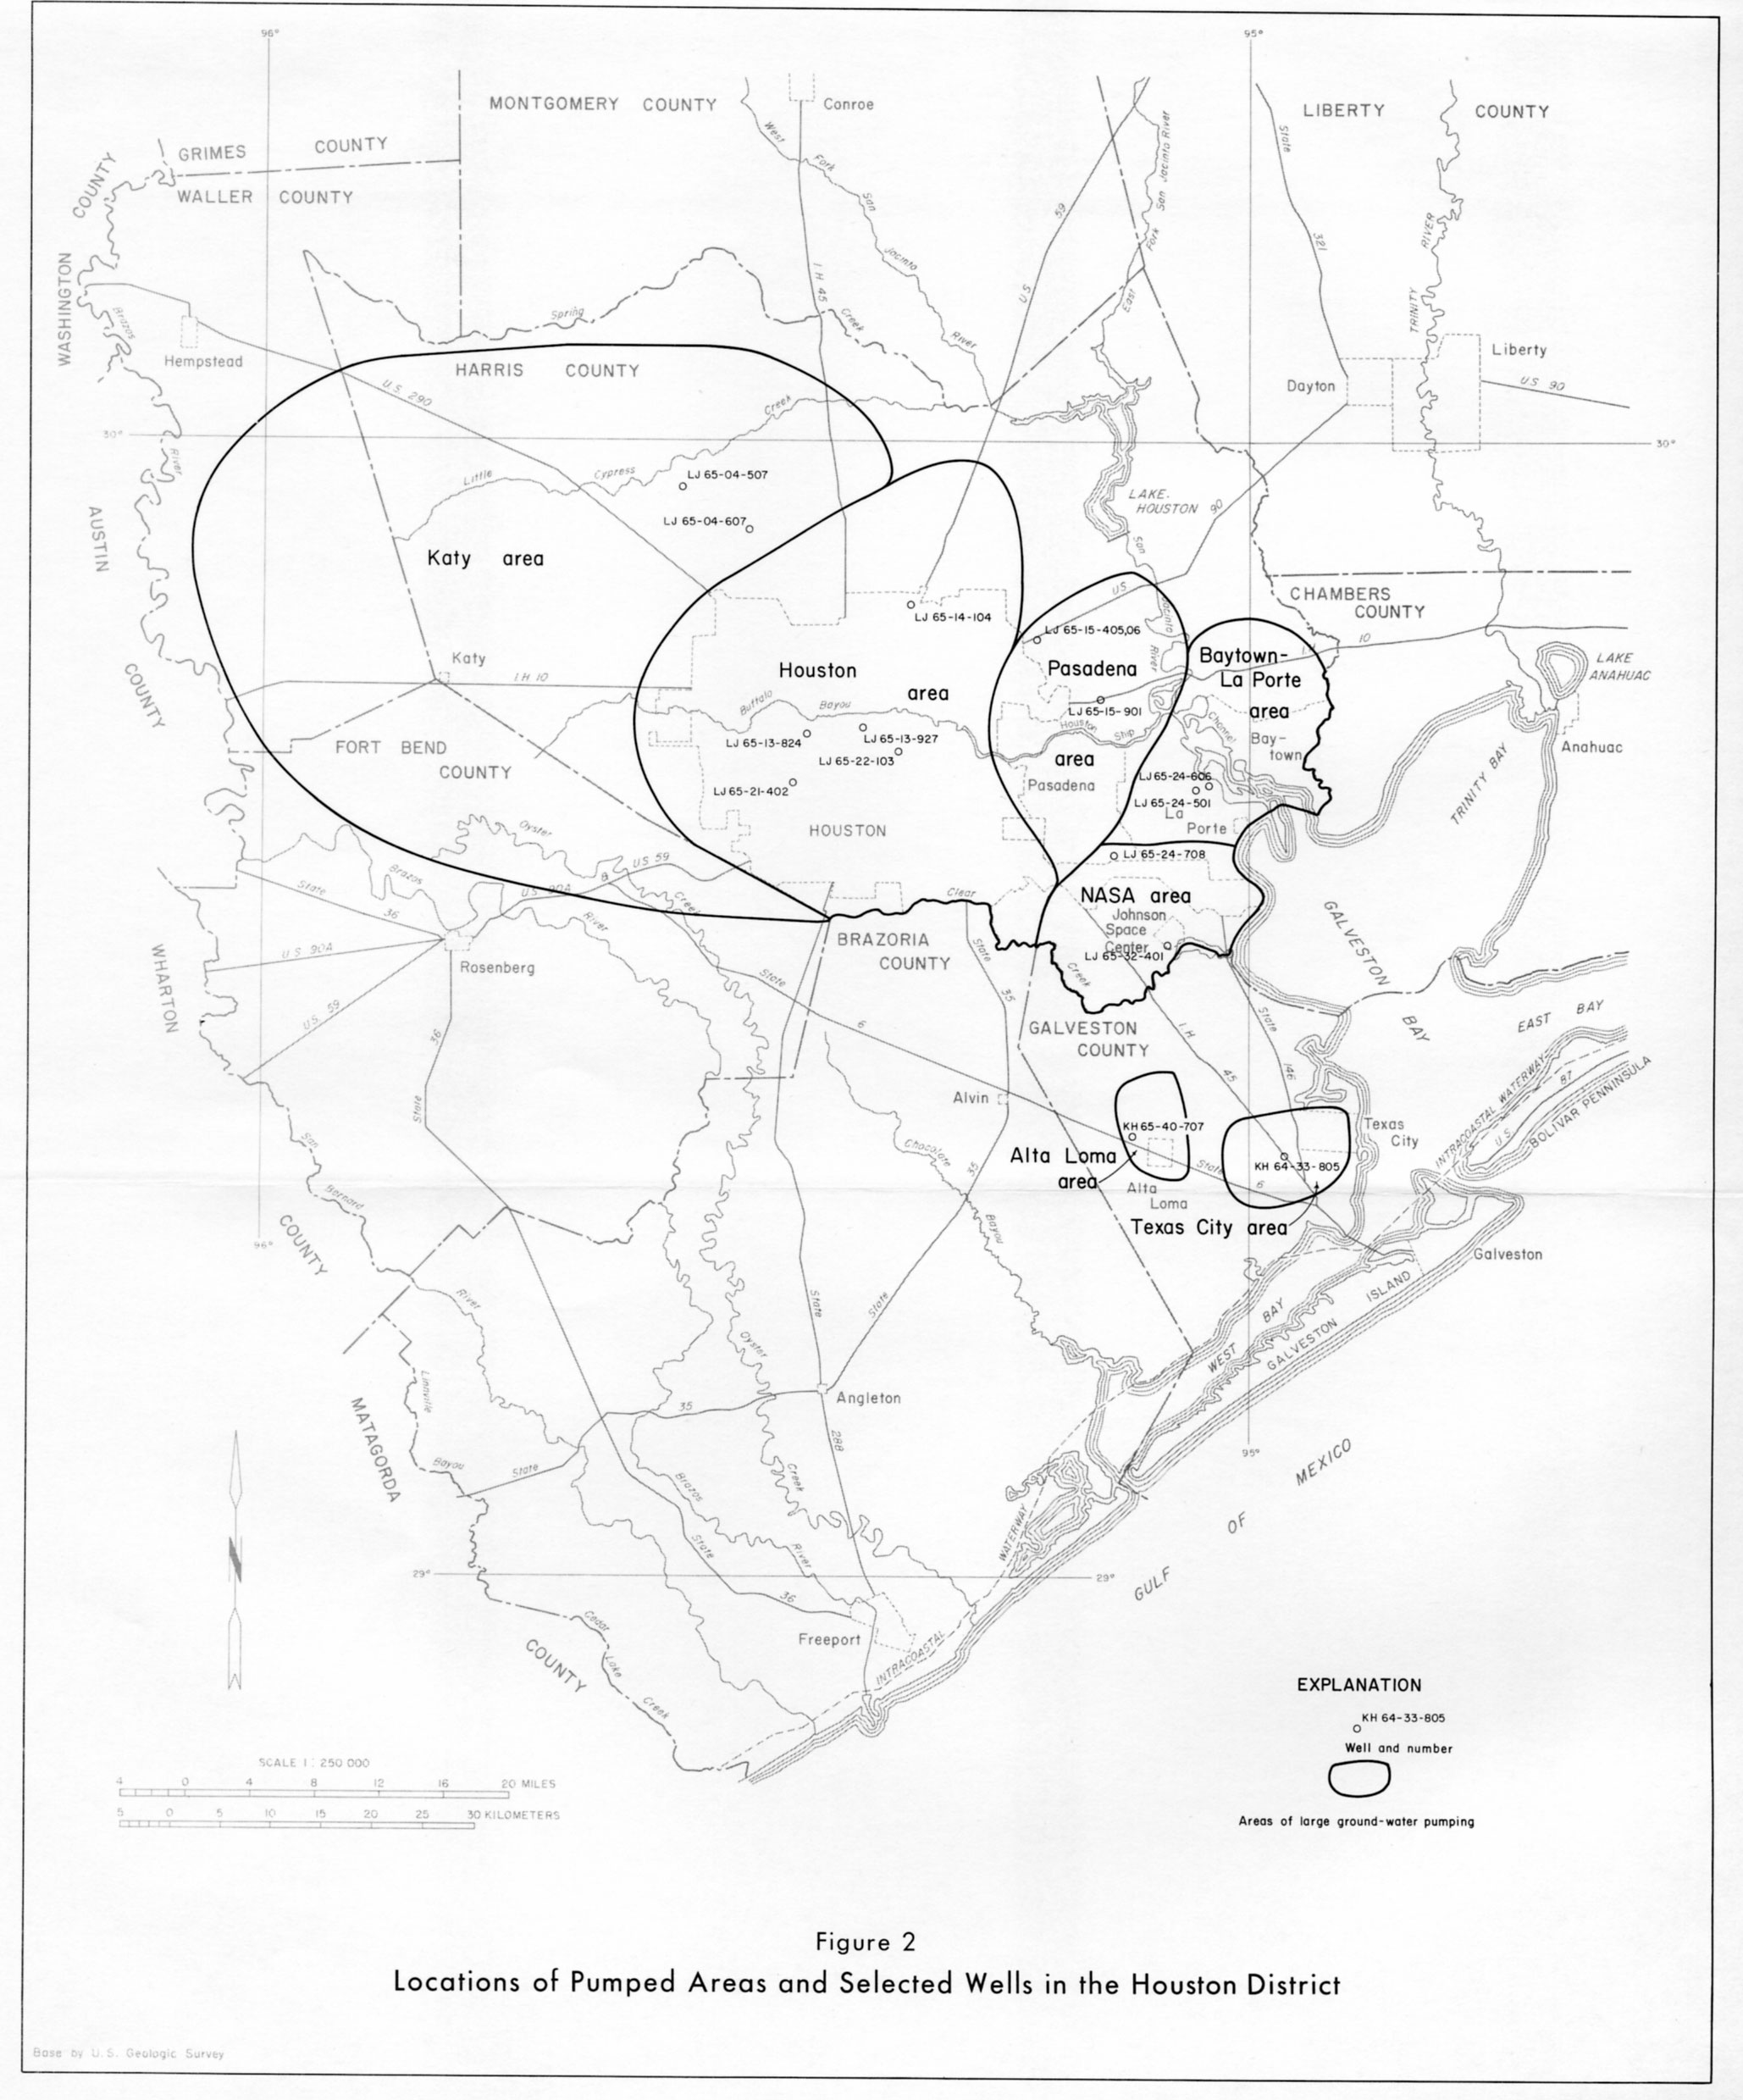
- figure 2 - Locations of Pumped Areas and selected wells in the Houston District
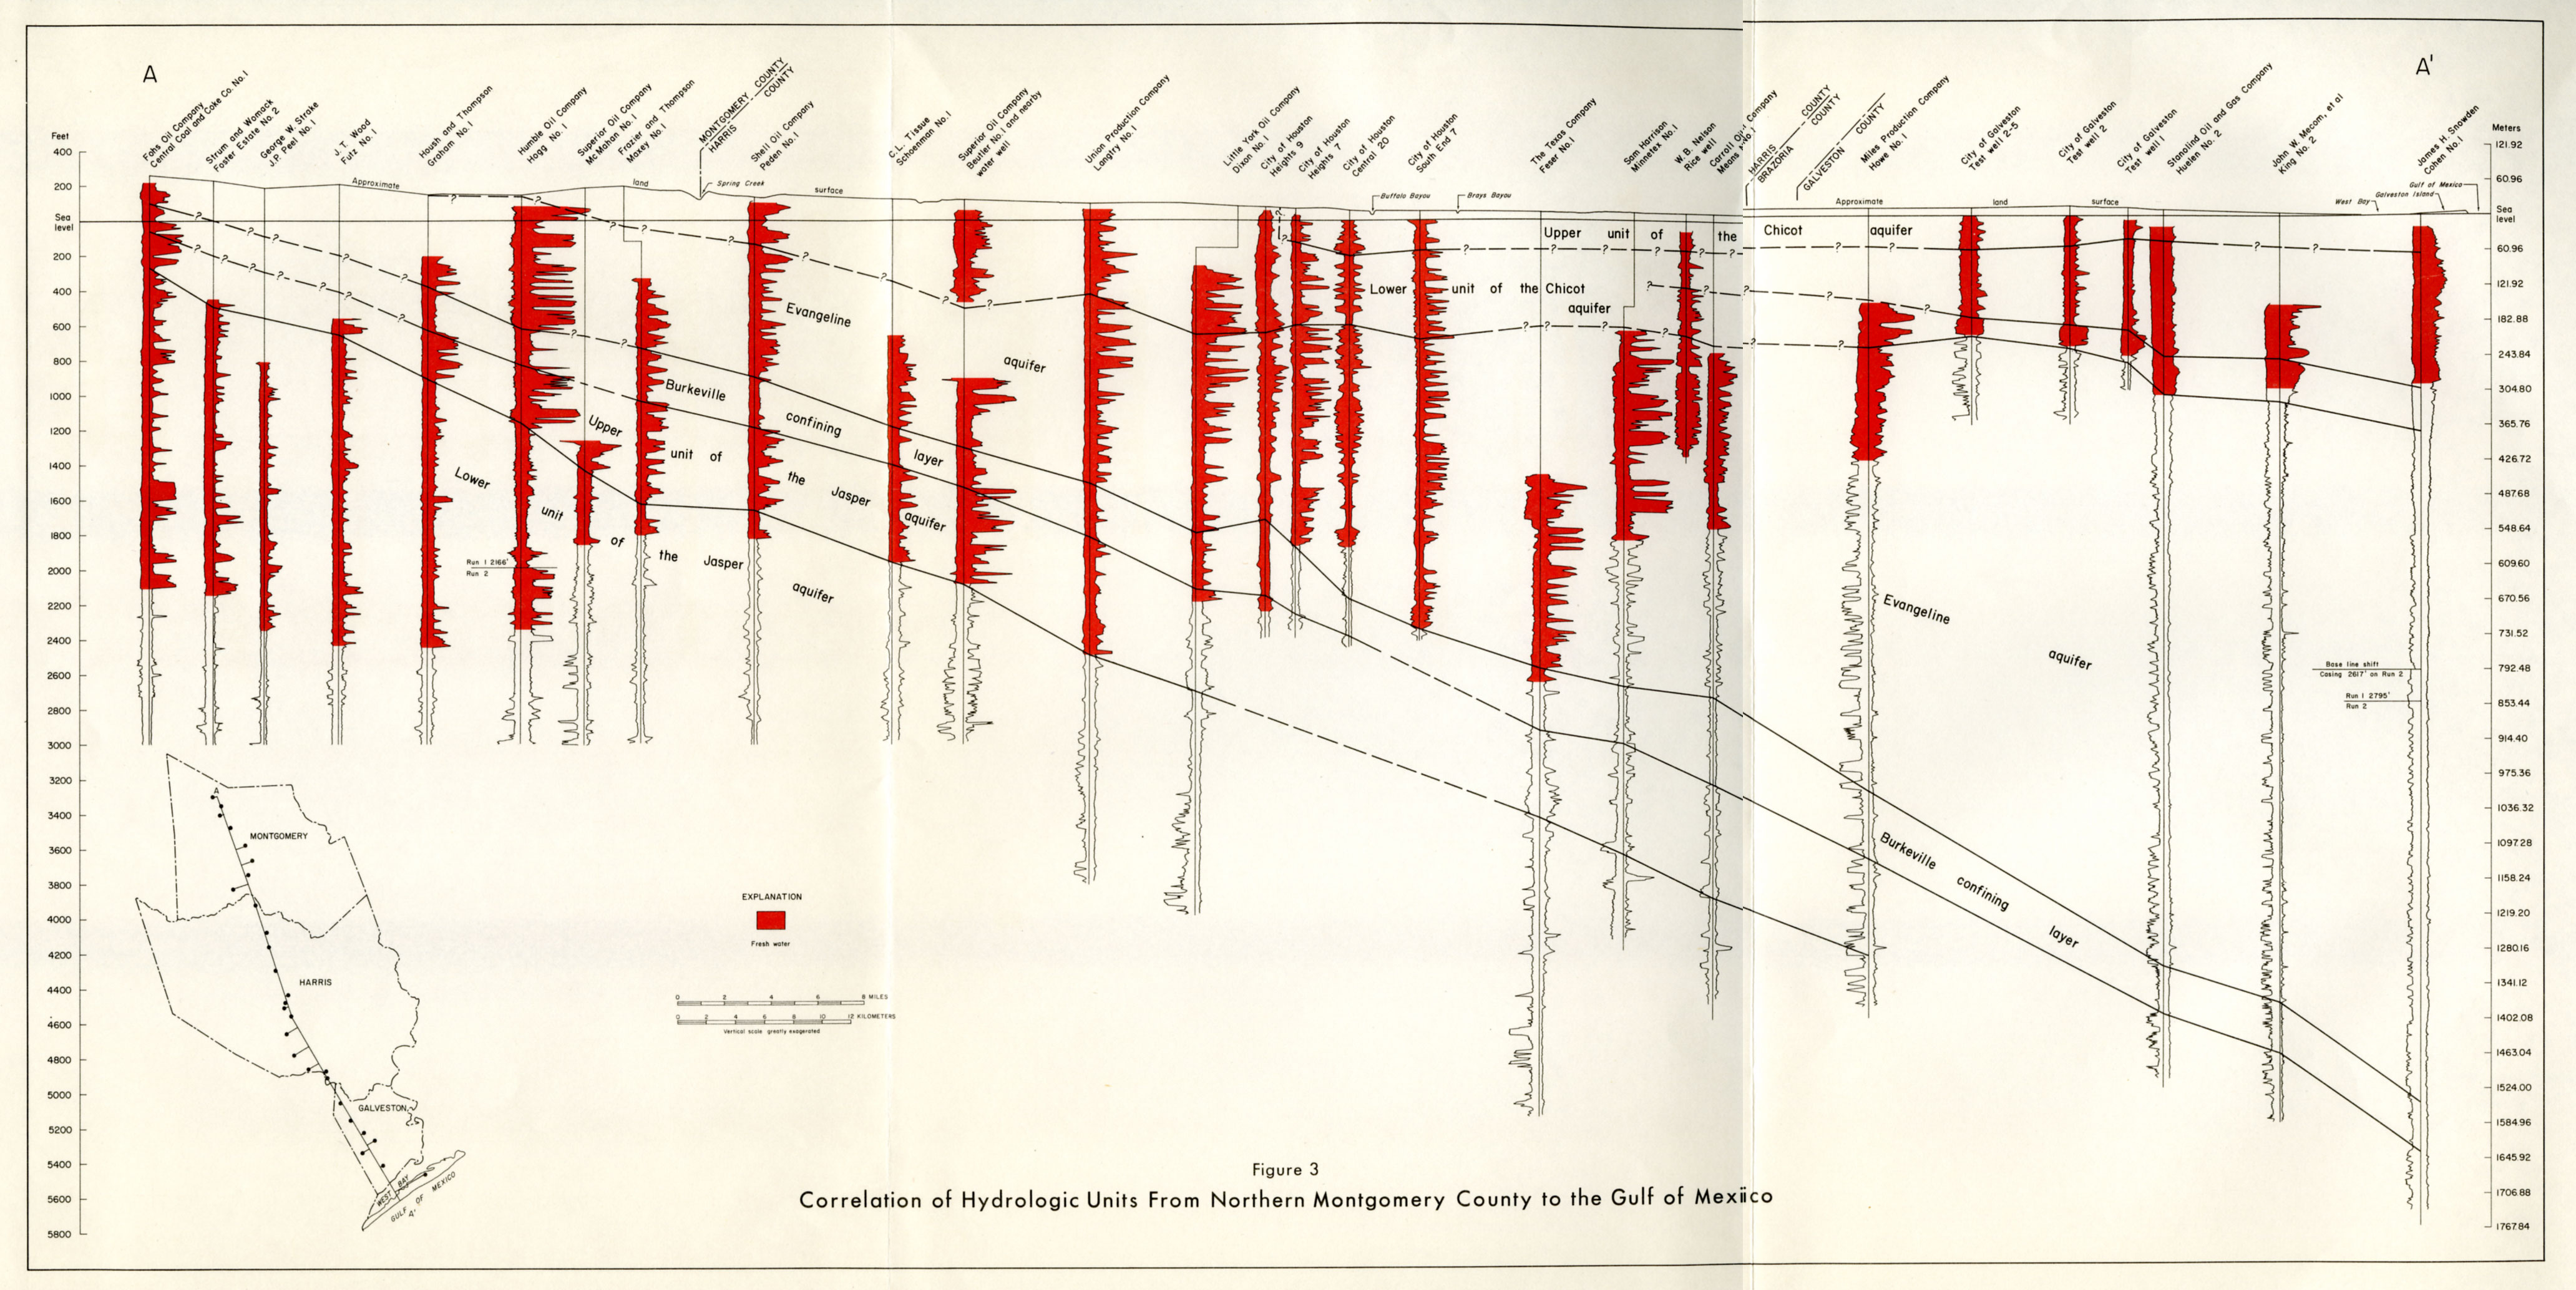
- figure 3 - Correlation of Hydrologic Units From Northern Montgomery County to the Gulf of Mexico
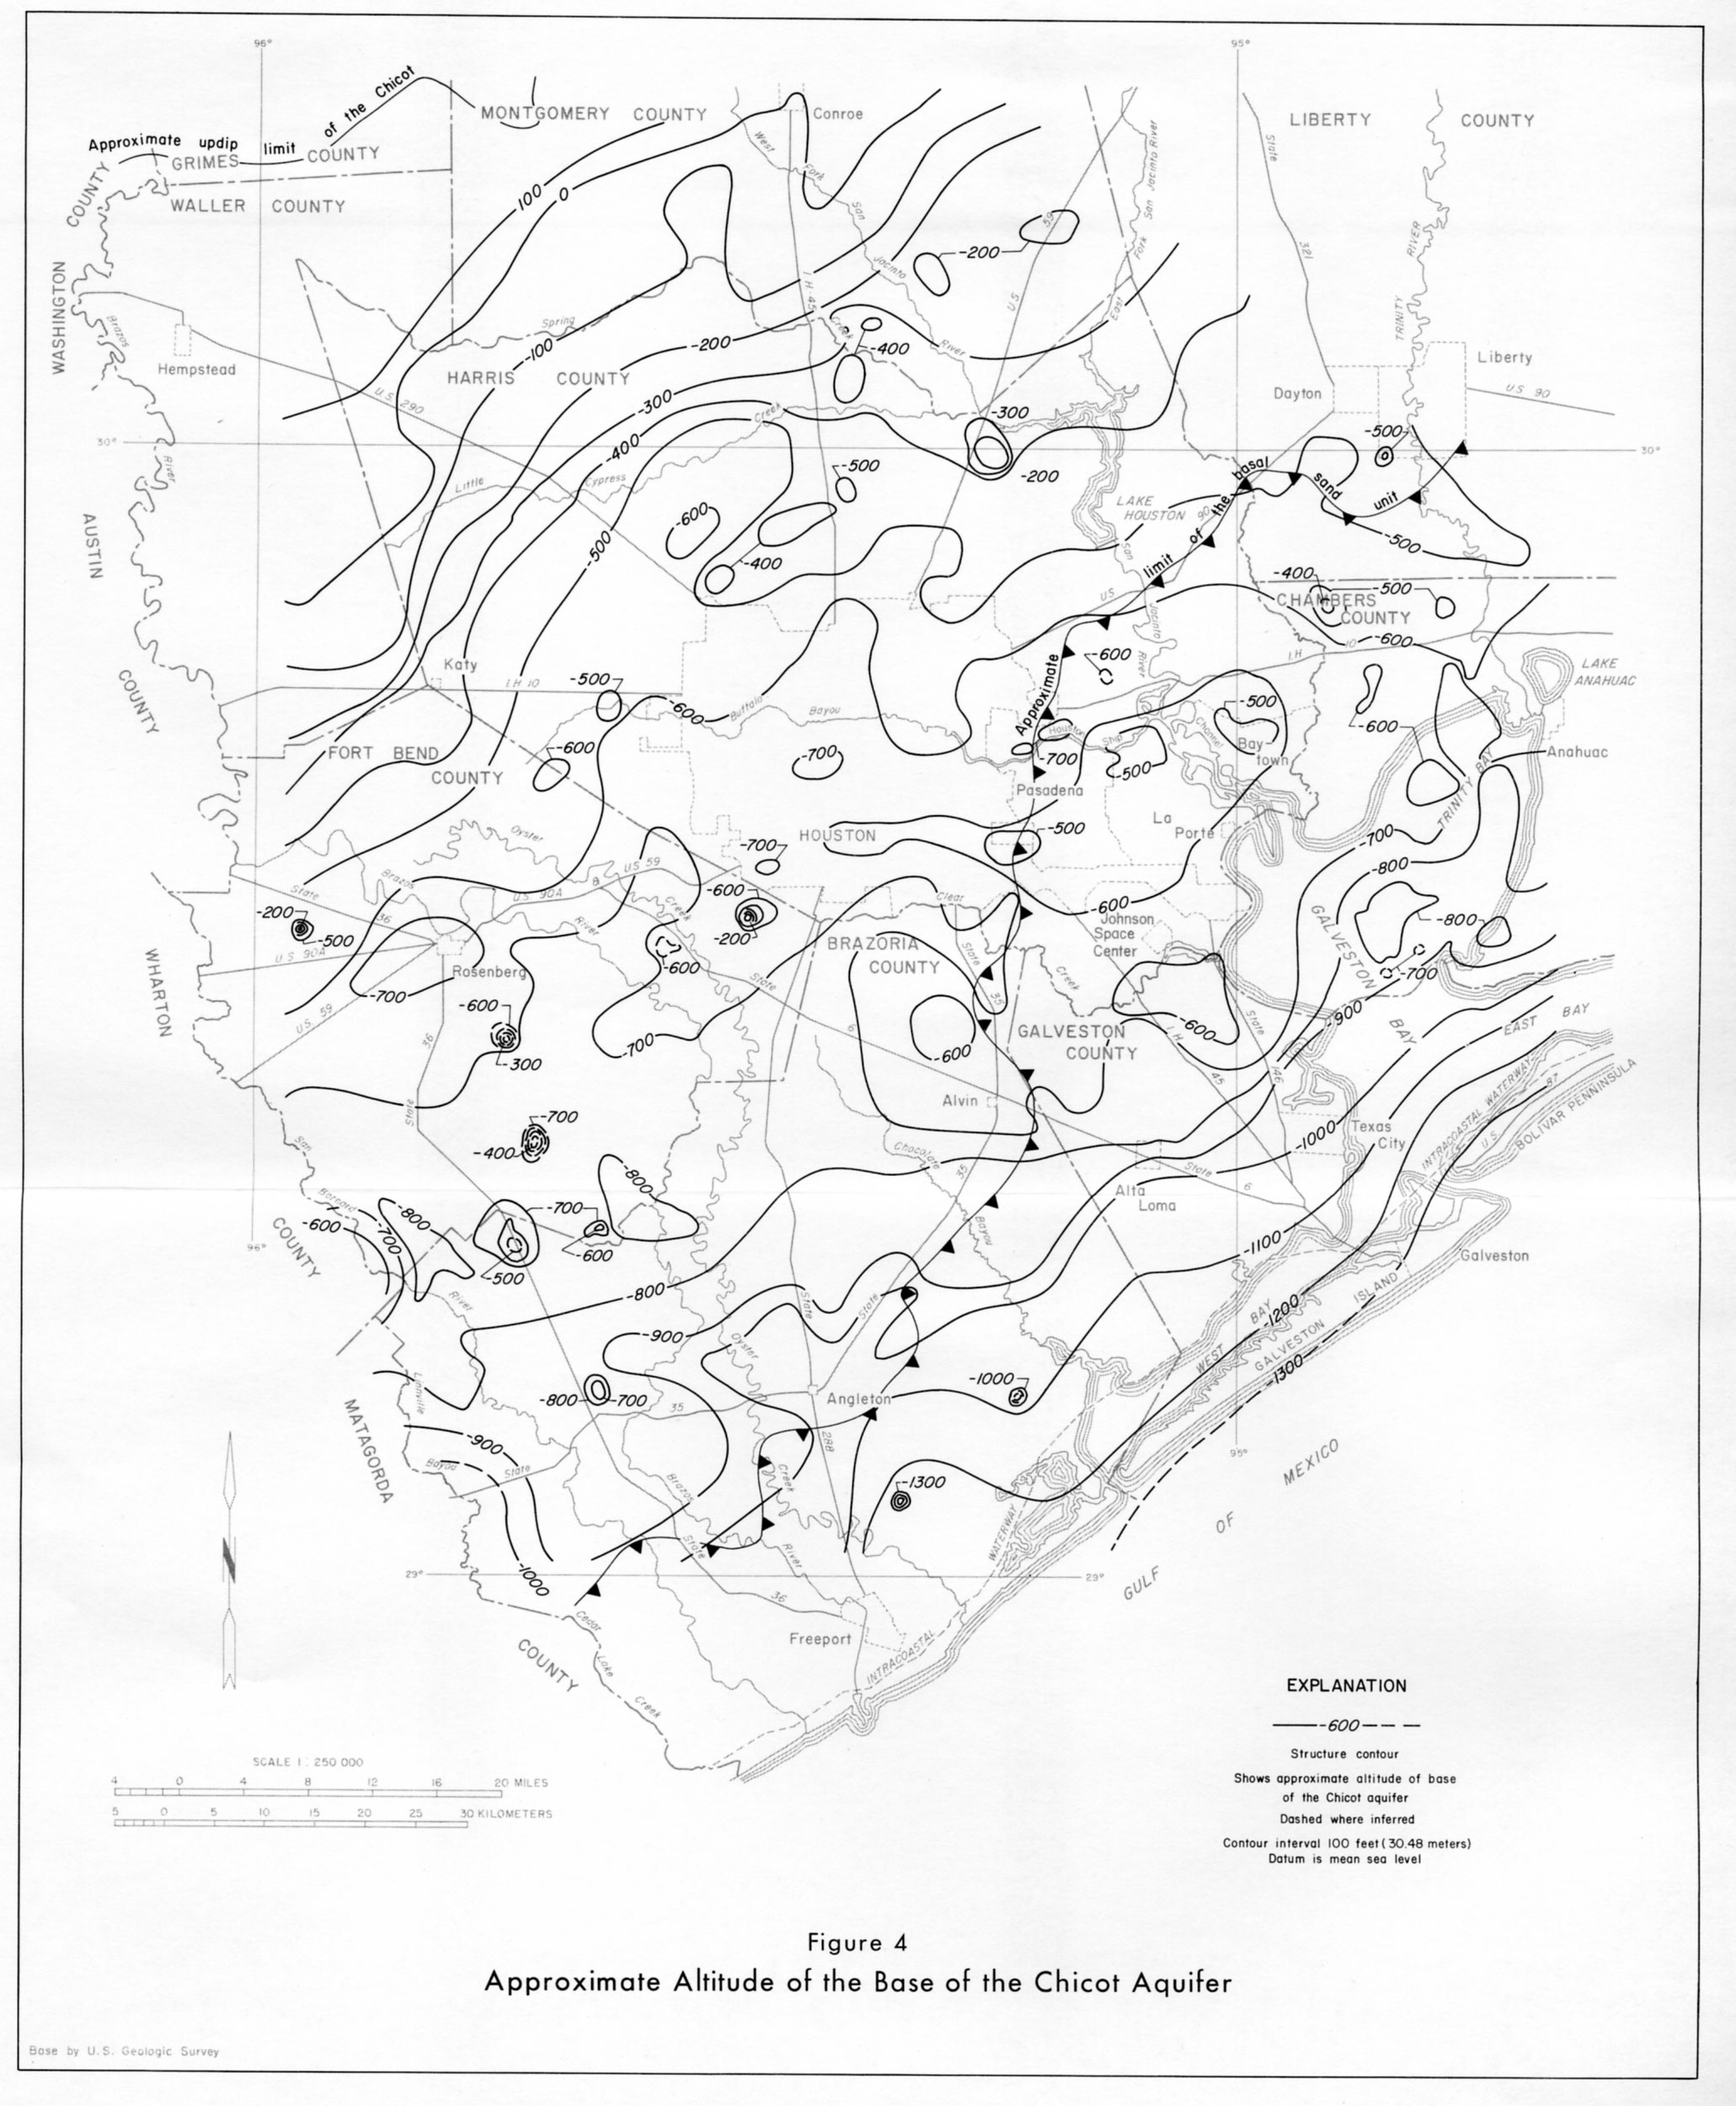
- figure 4 - Approximate Altitude of the Base of the Chicot Aquifer
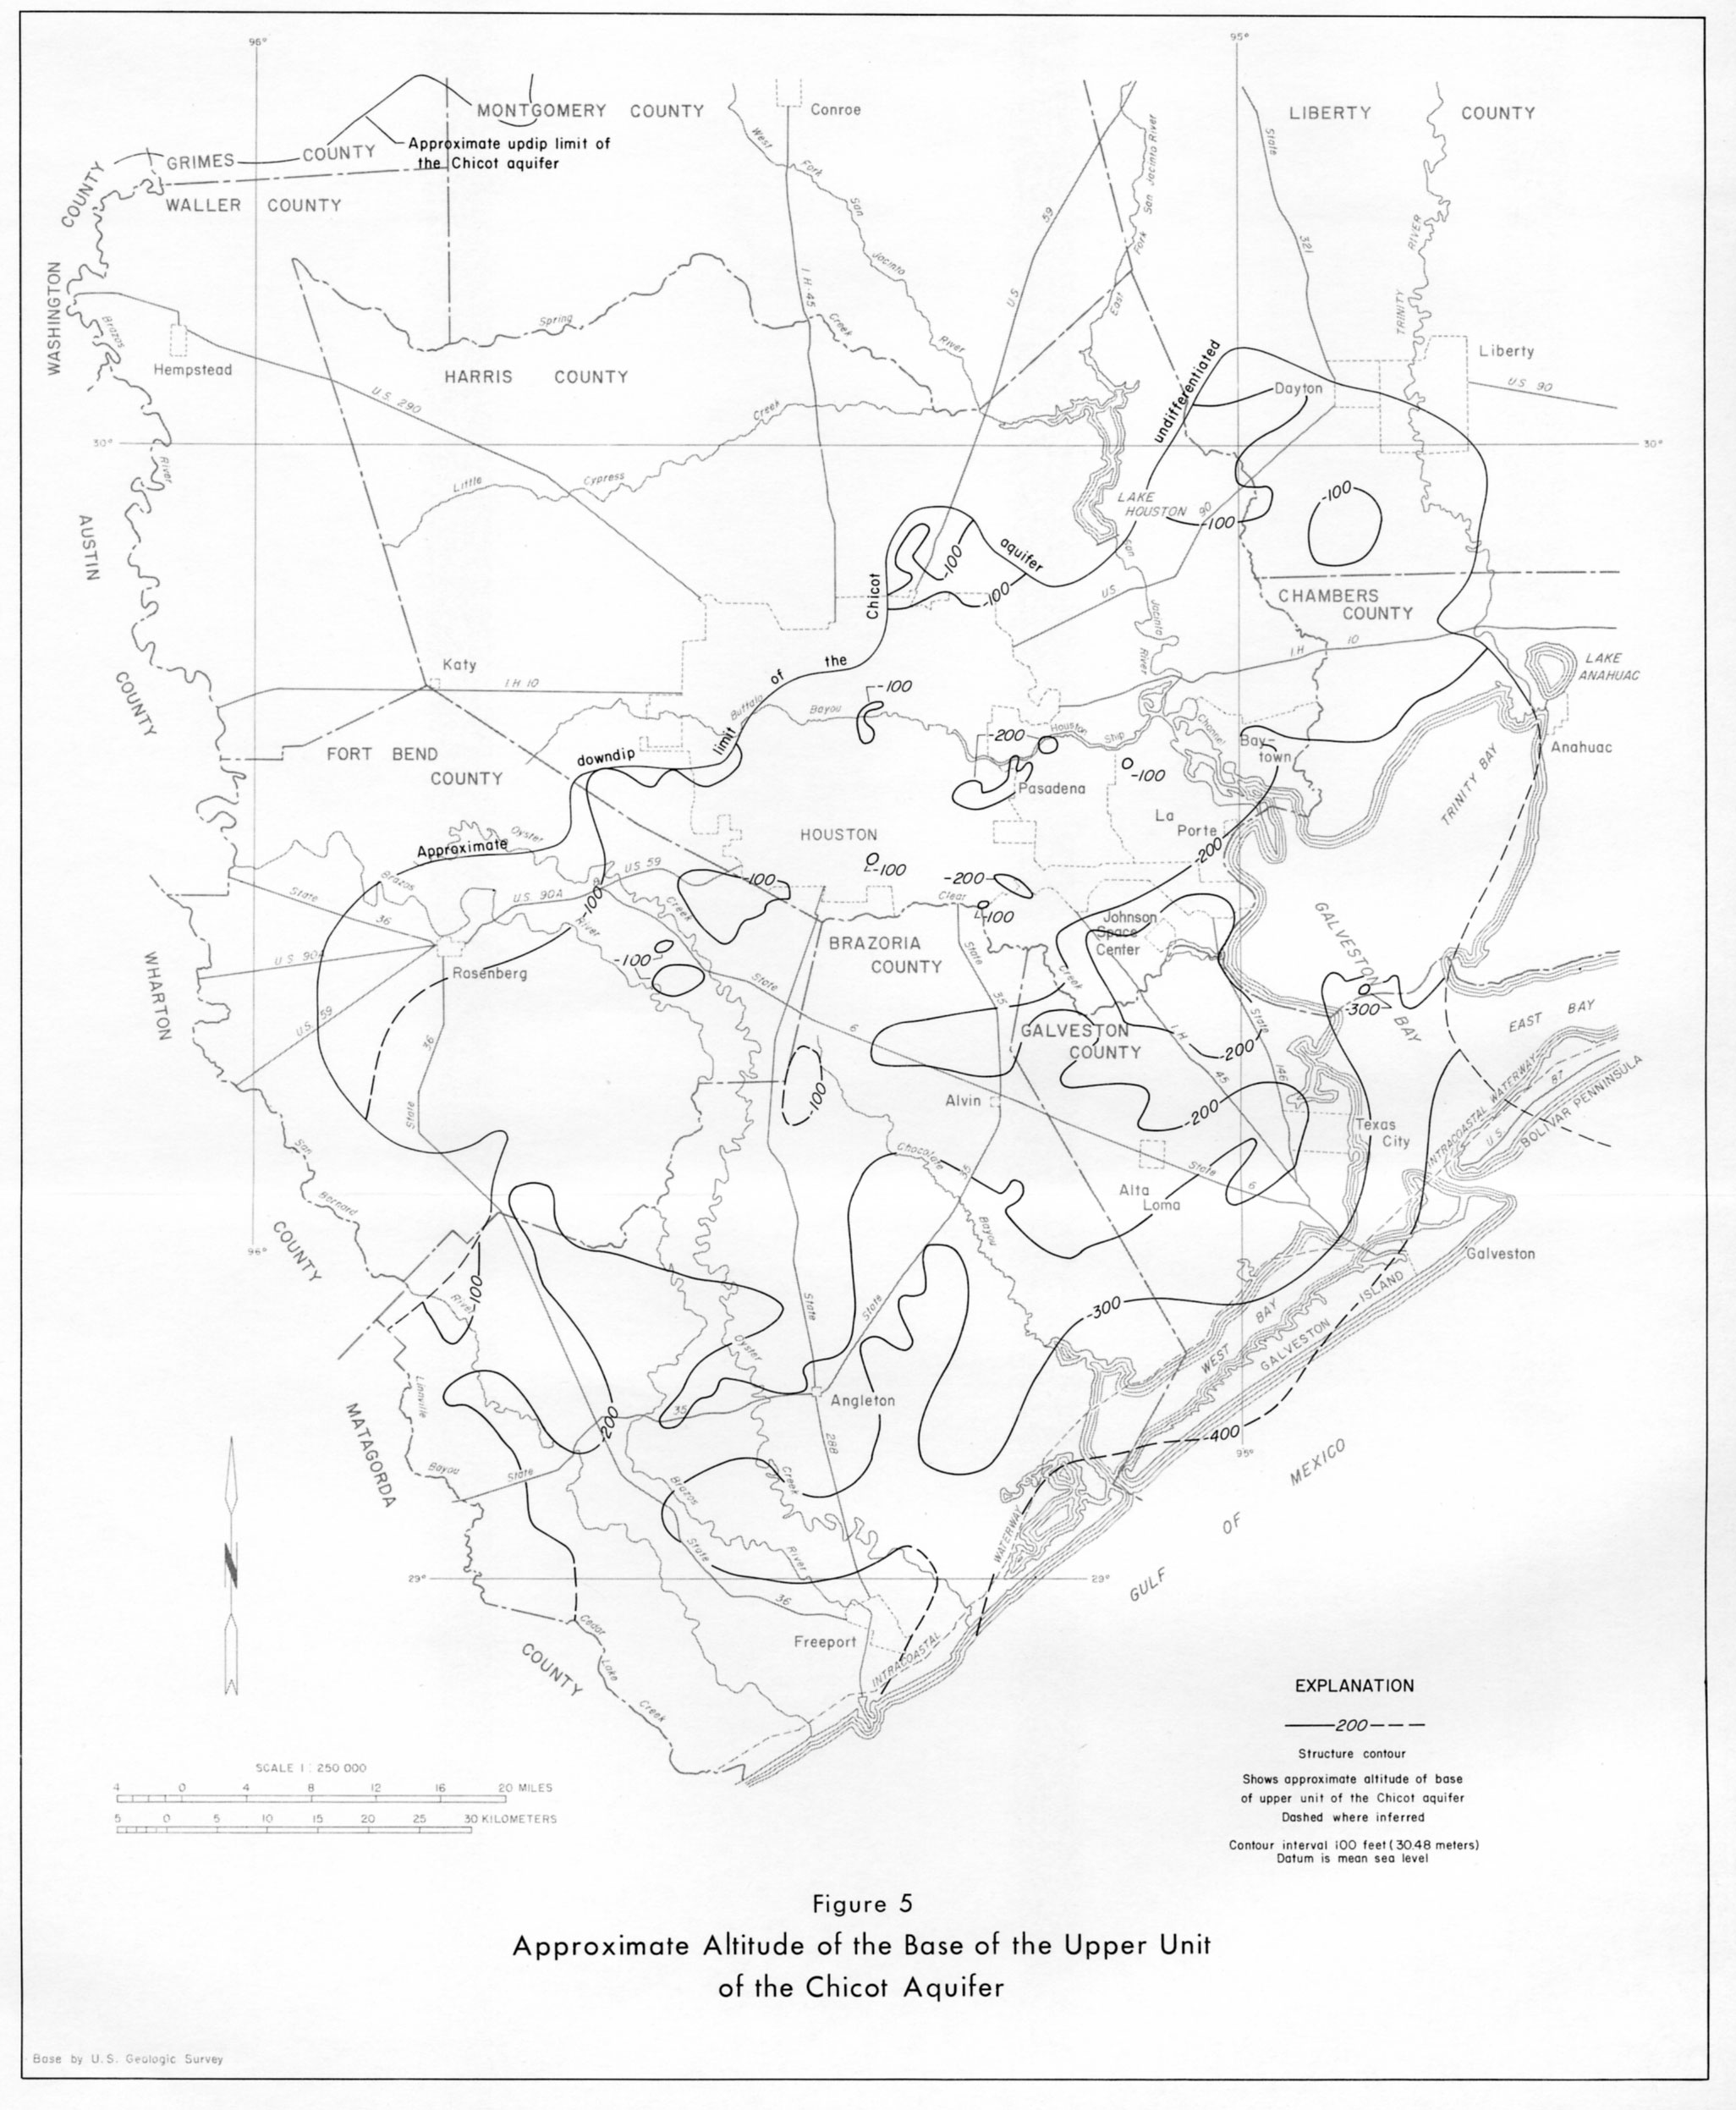
- figure 5 - Approximate Altitude of the Base of the Upper Unit of the Chicot Aquifer
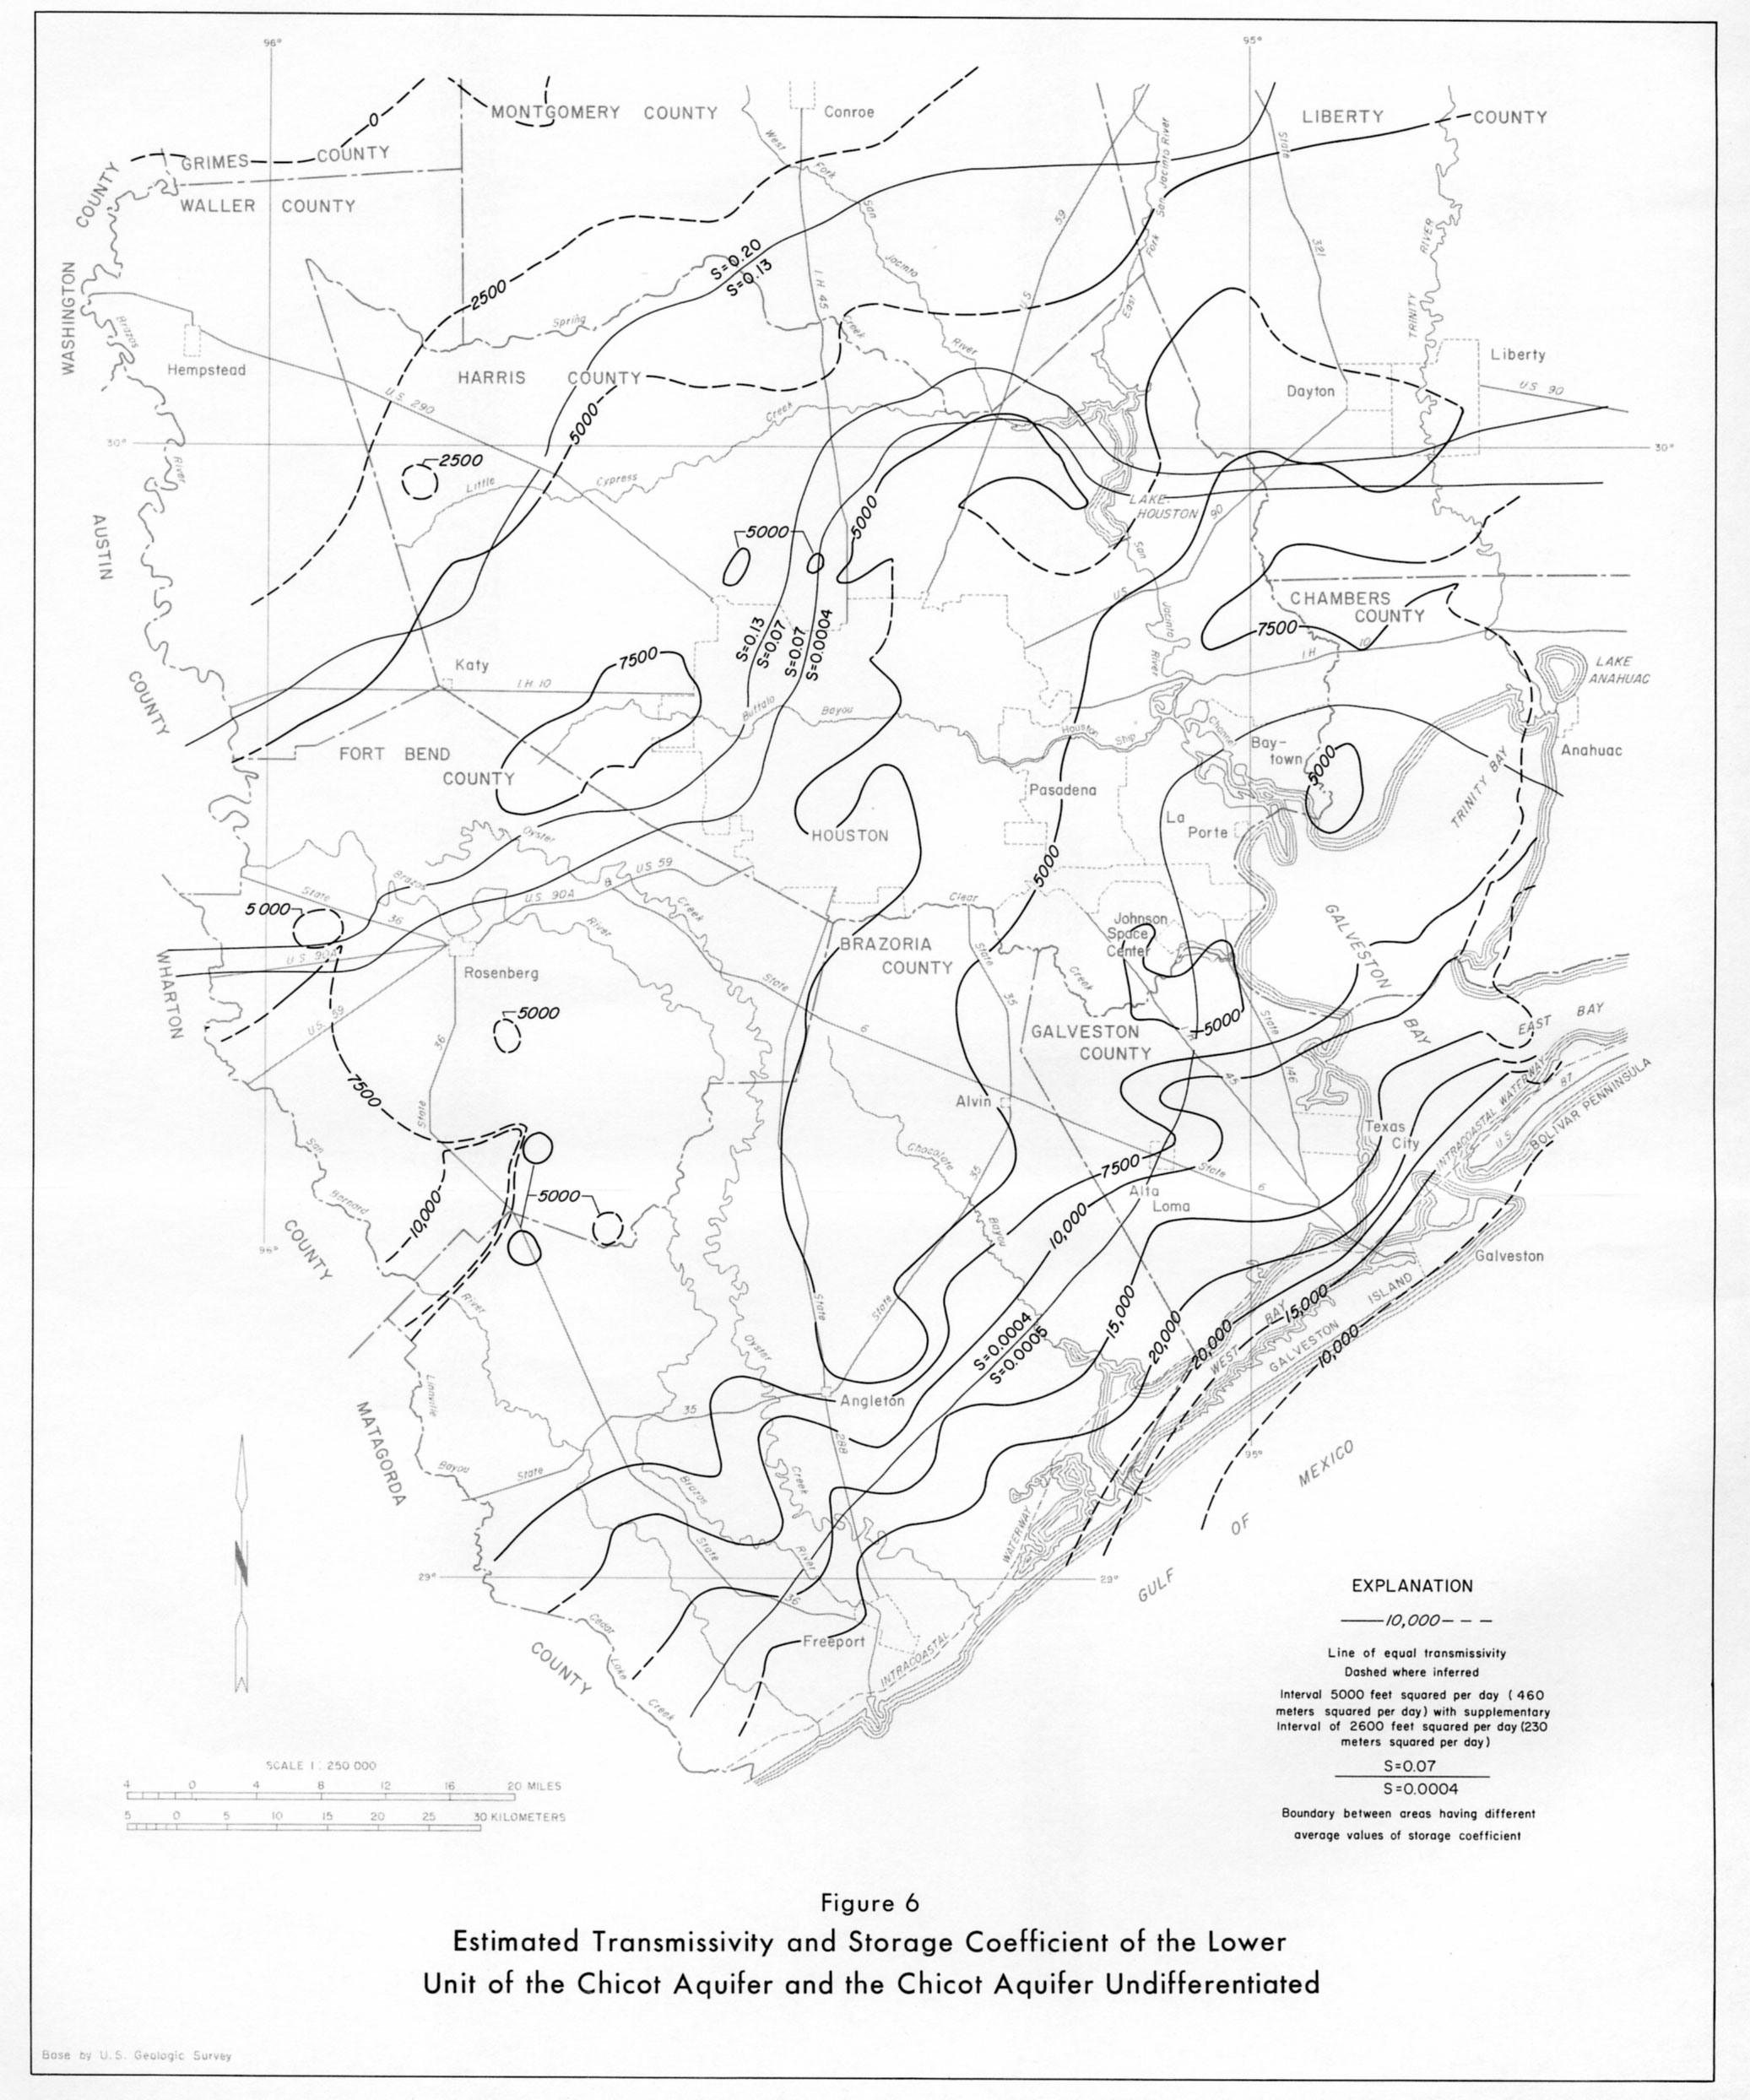
- figure 6 - Estimated Transmissivity and Storage Coefficient of the Lower Unit of the Chicot Aquifer and the Chicot Aquifer Undifferentiated
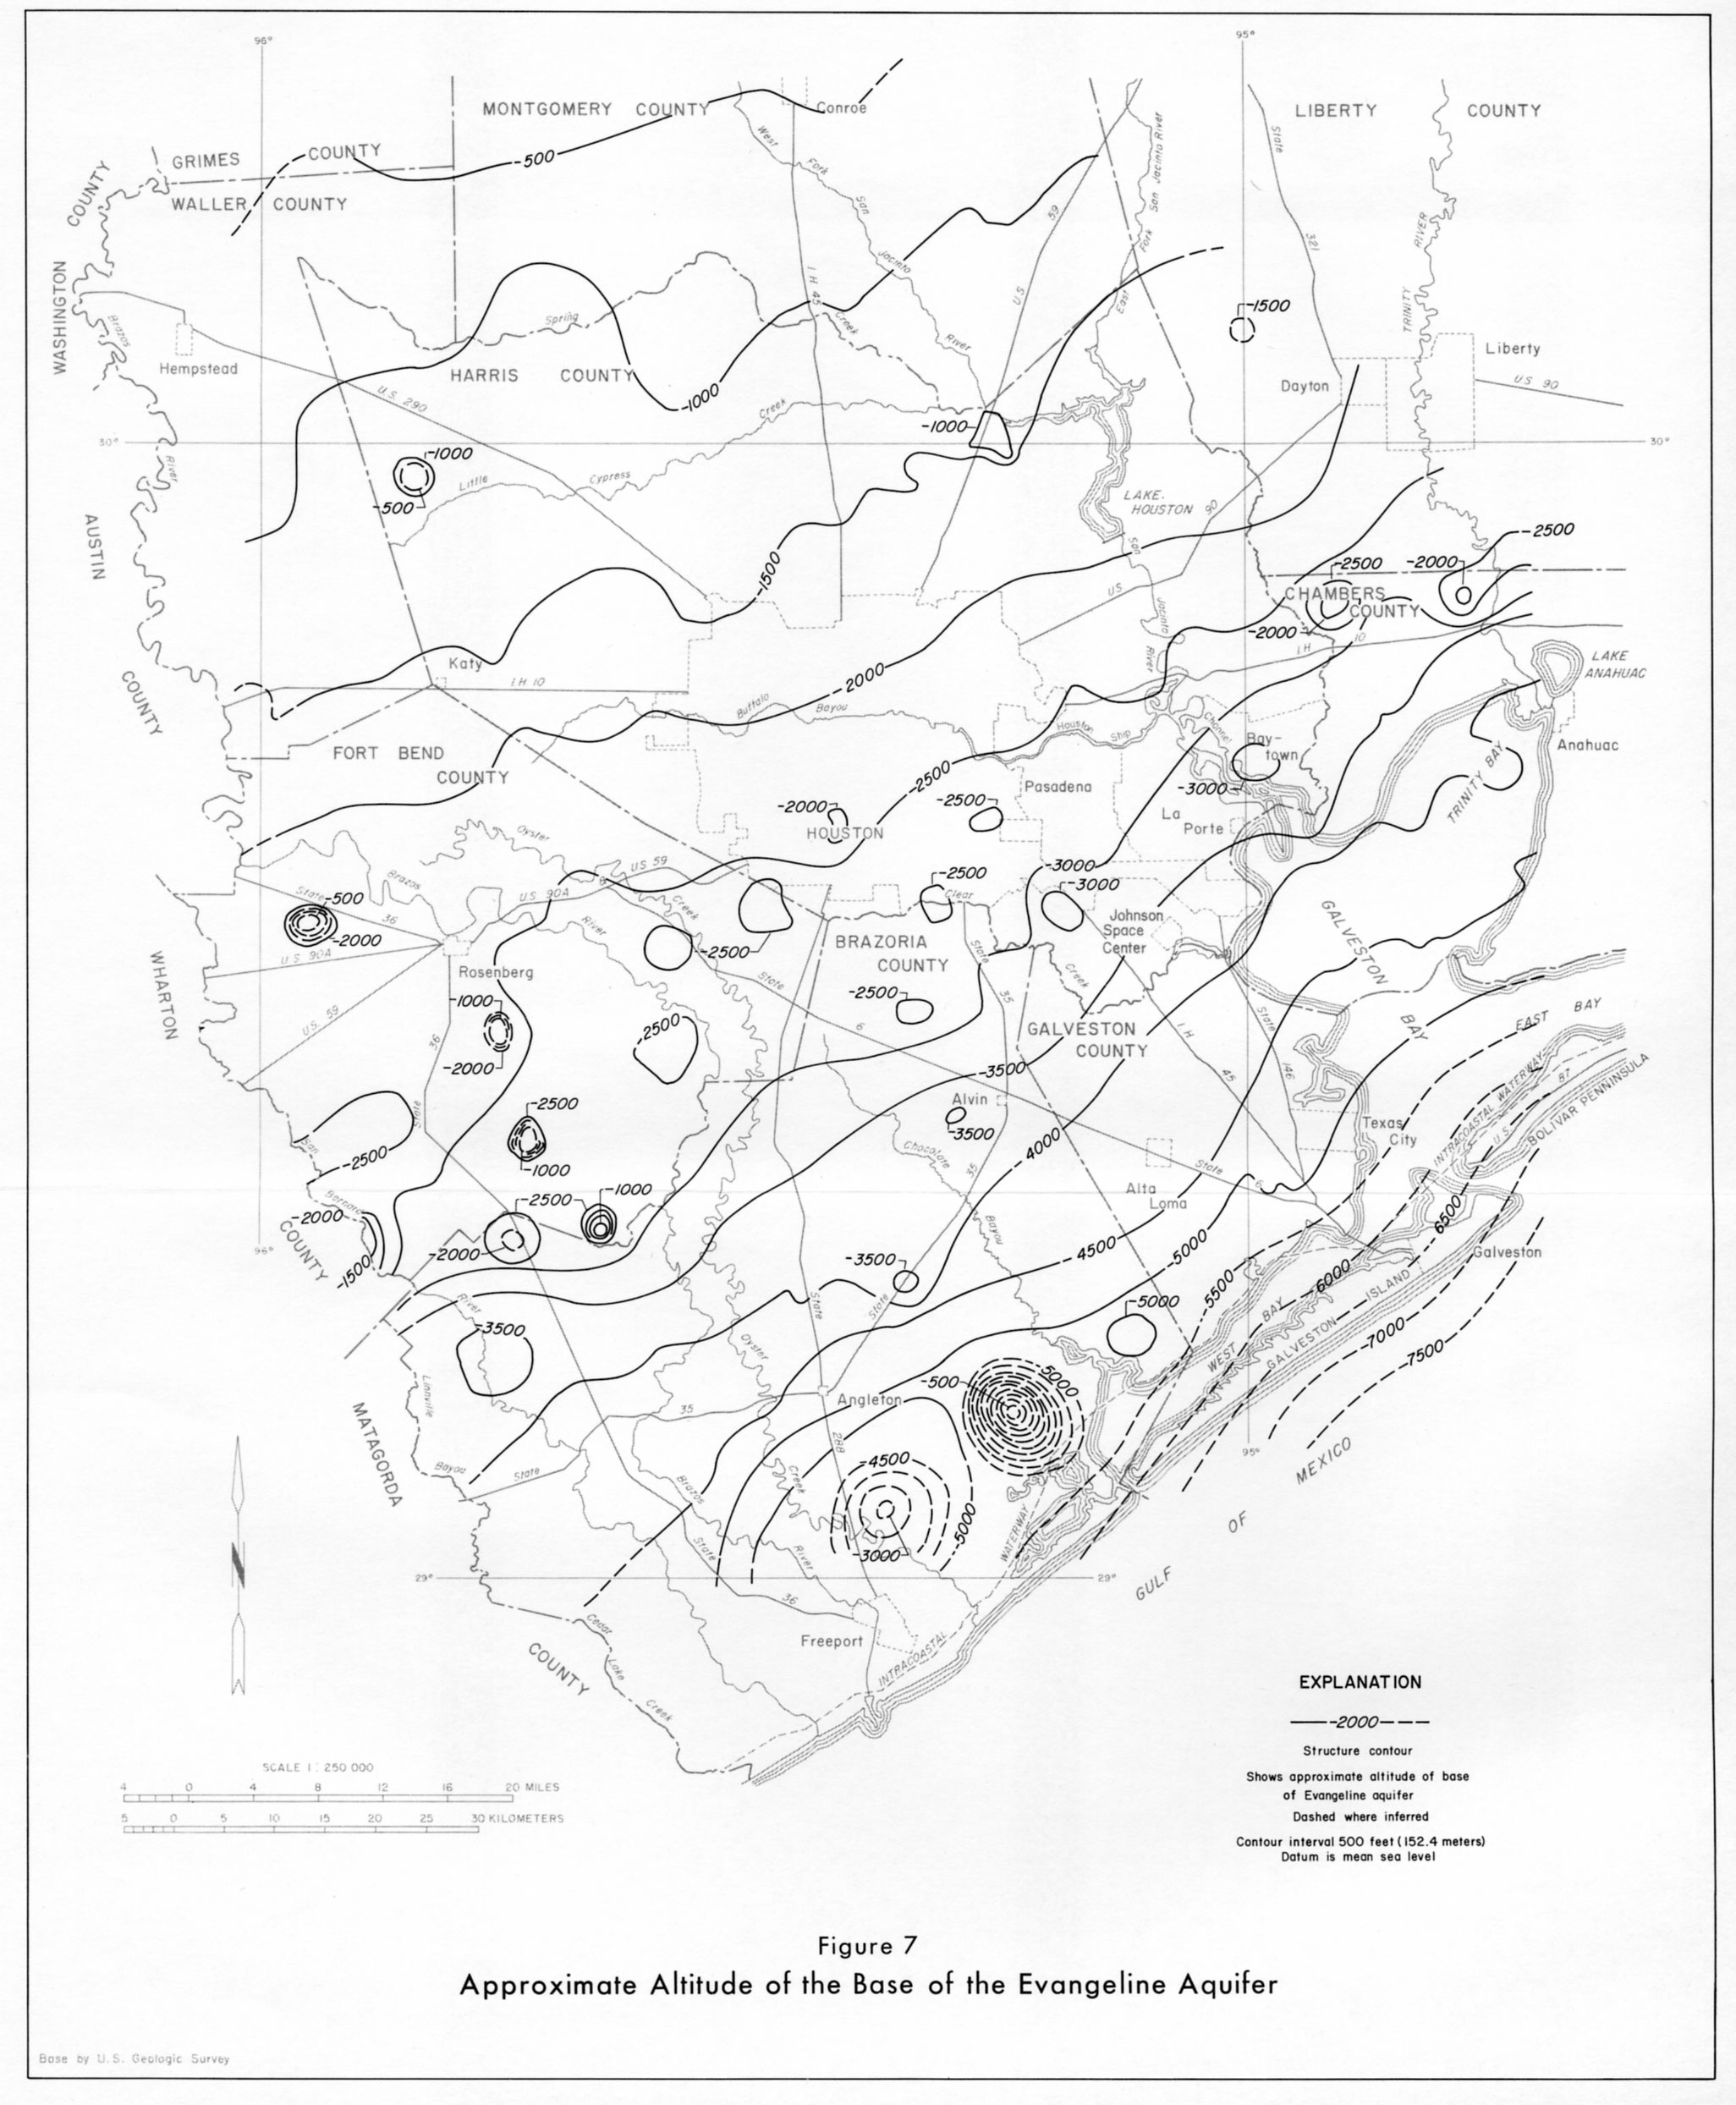
- figure 7 - Approximate Altitude of the base of the Evangeline Aquifer
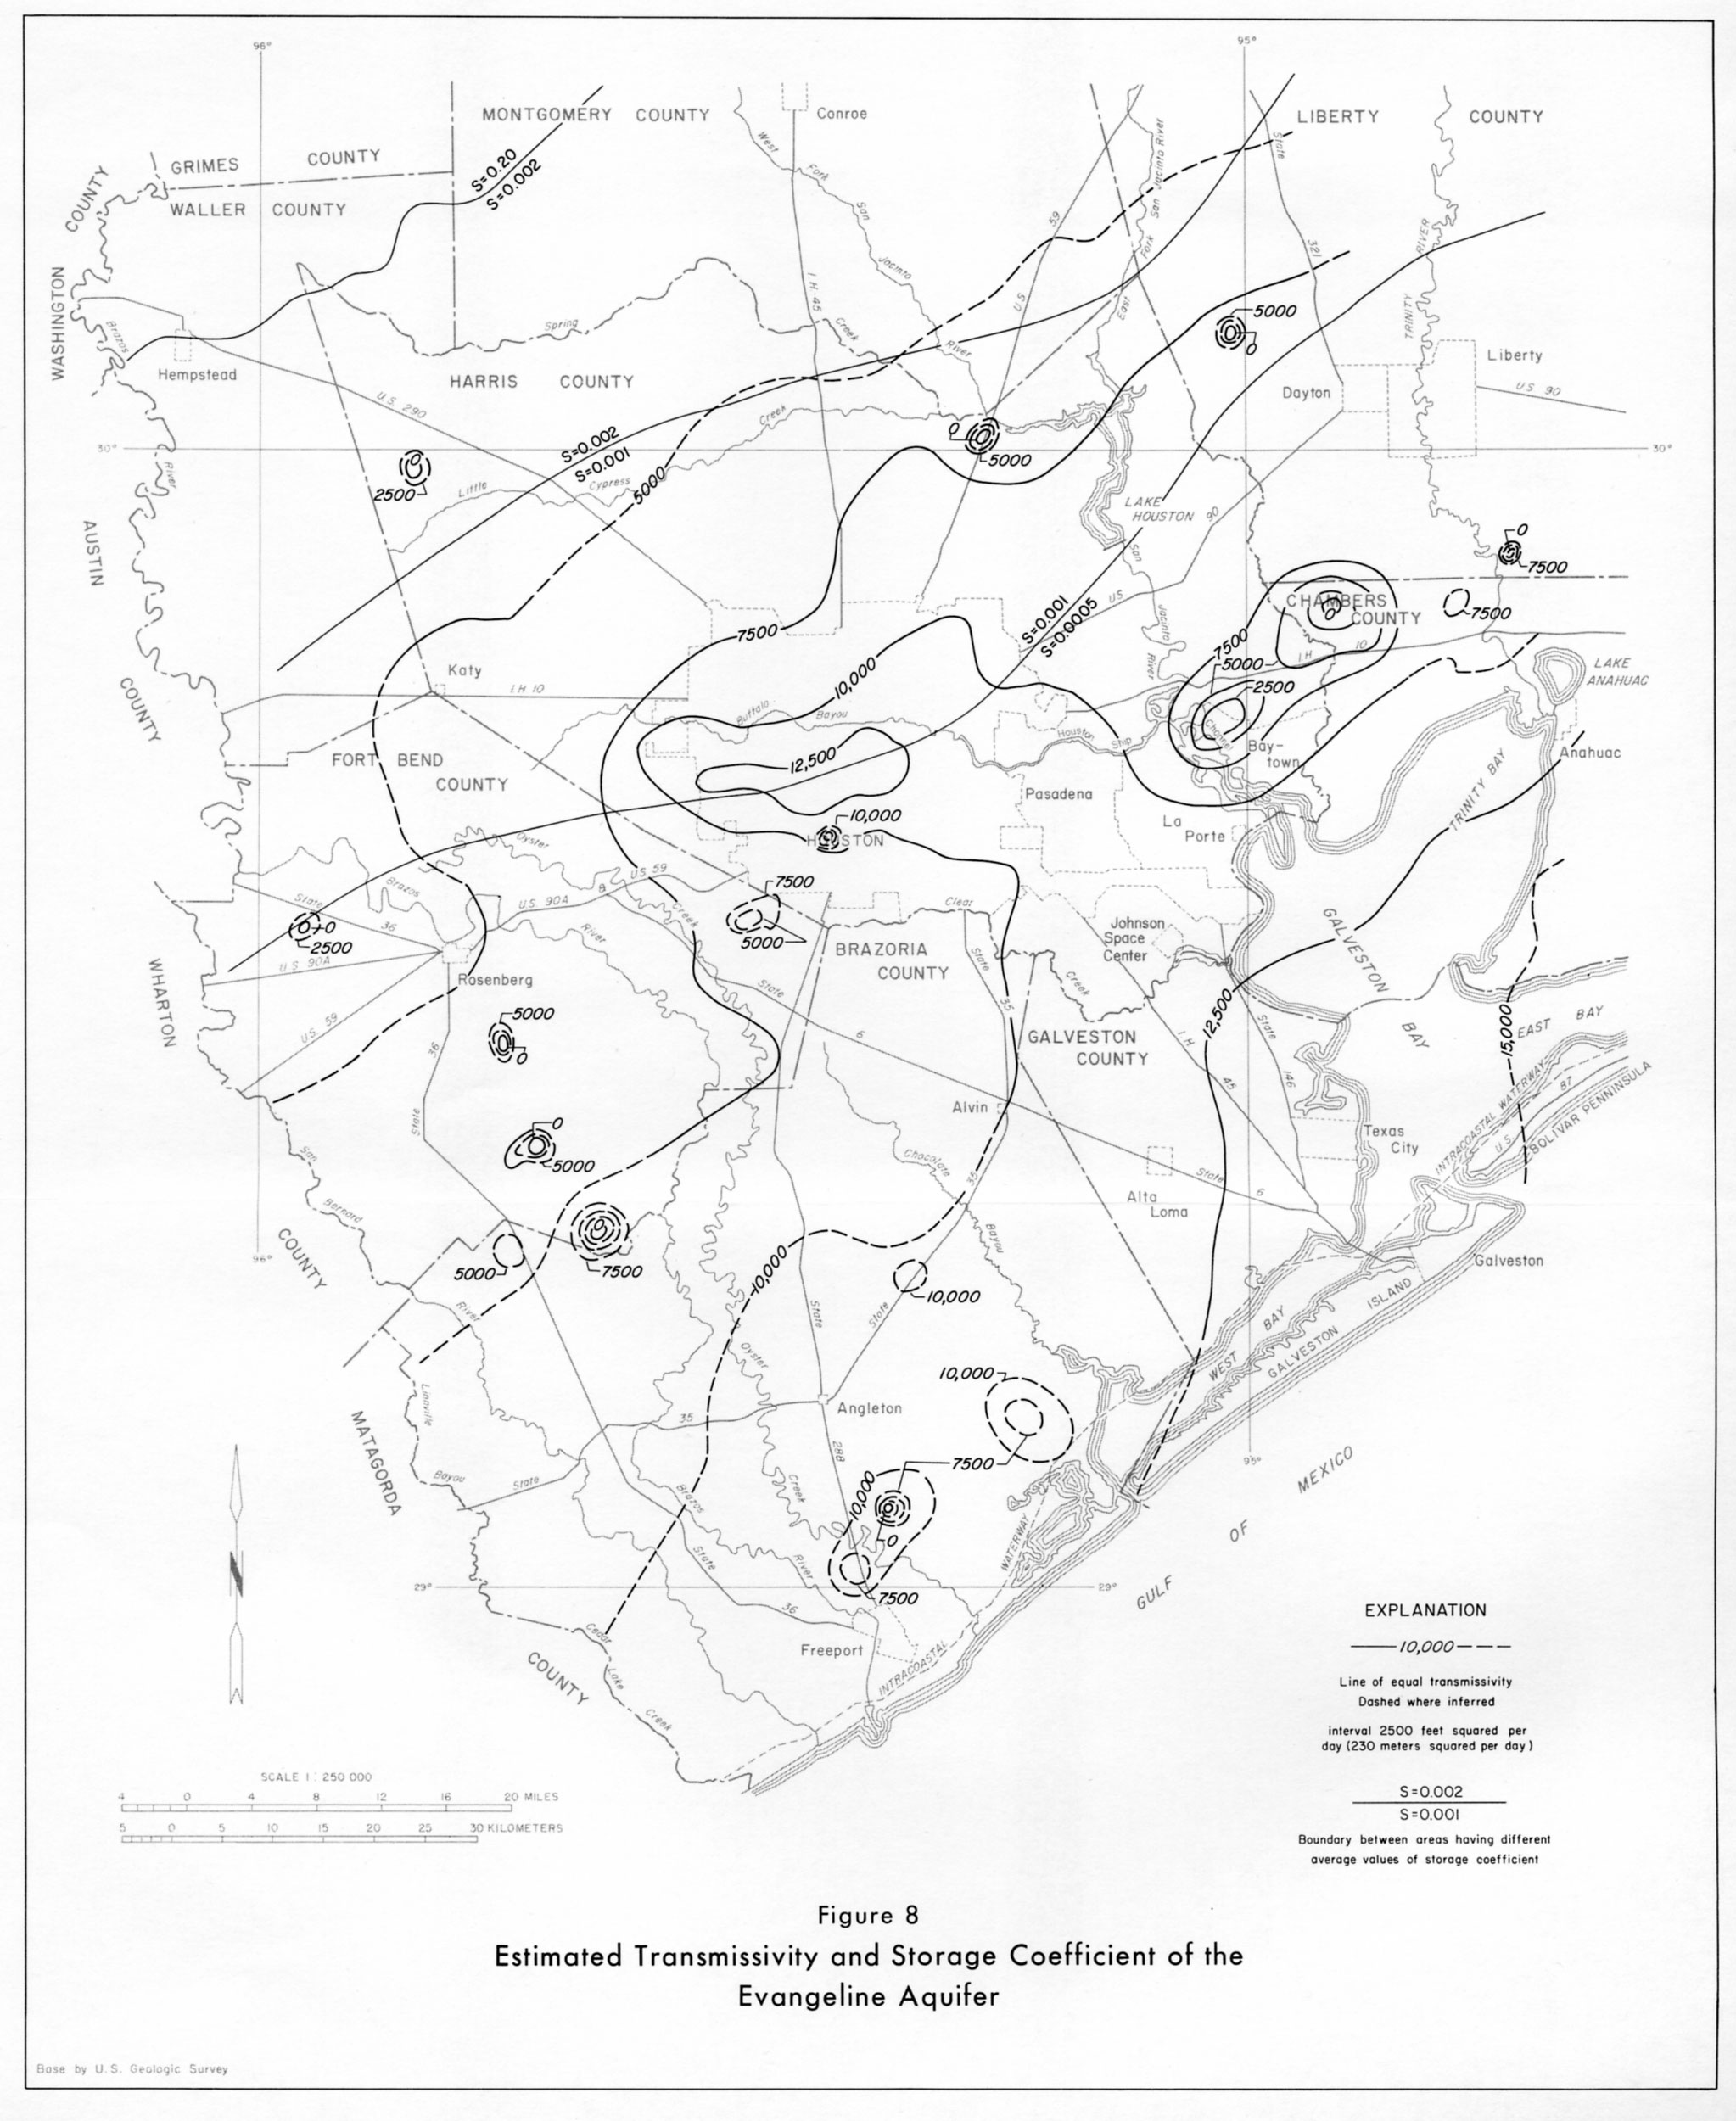
- figure 8 - Estimated Transmissivity and Storage Coefficient of the Evangeline Aquifer
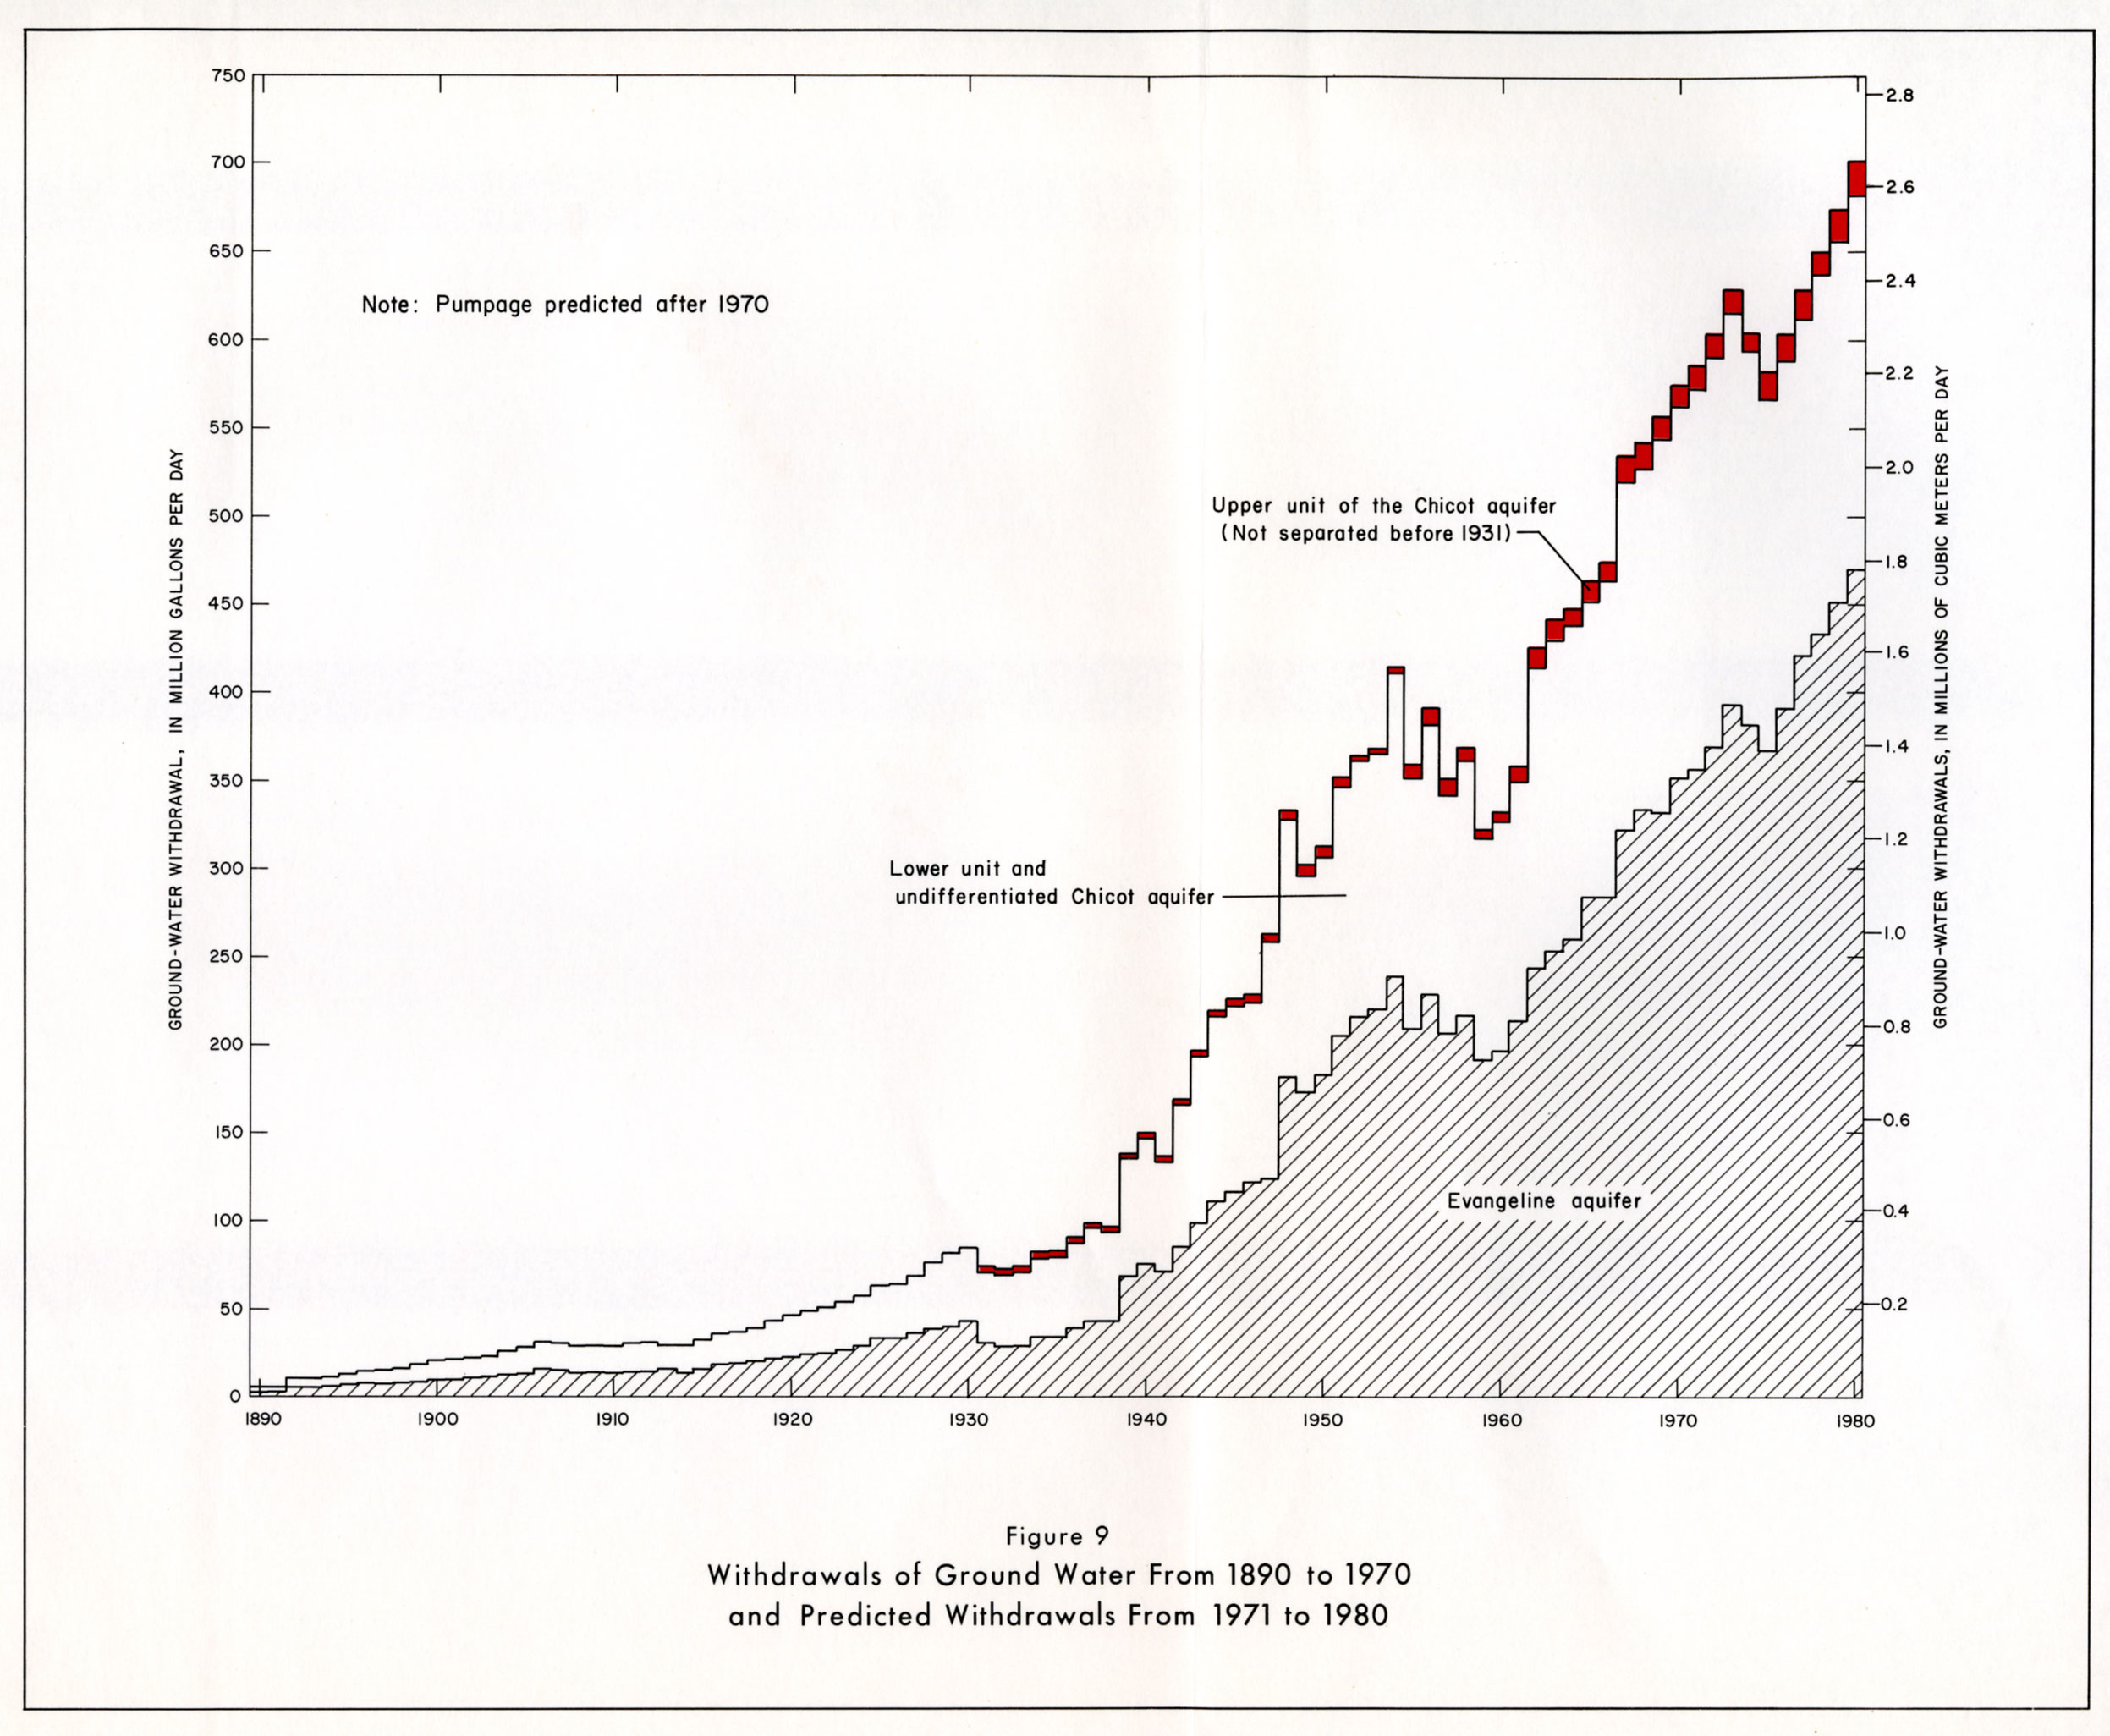
- figure 9 - Withdrawals of Ground Water From 1890 to 1970 and Predicted Withdrawals From 1971 to 1980
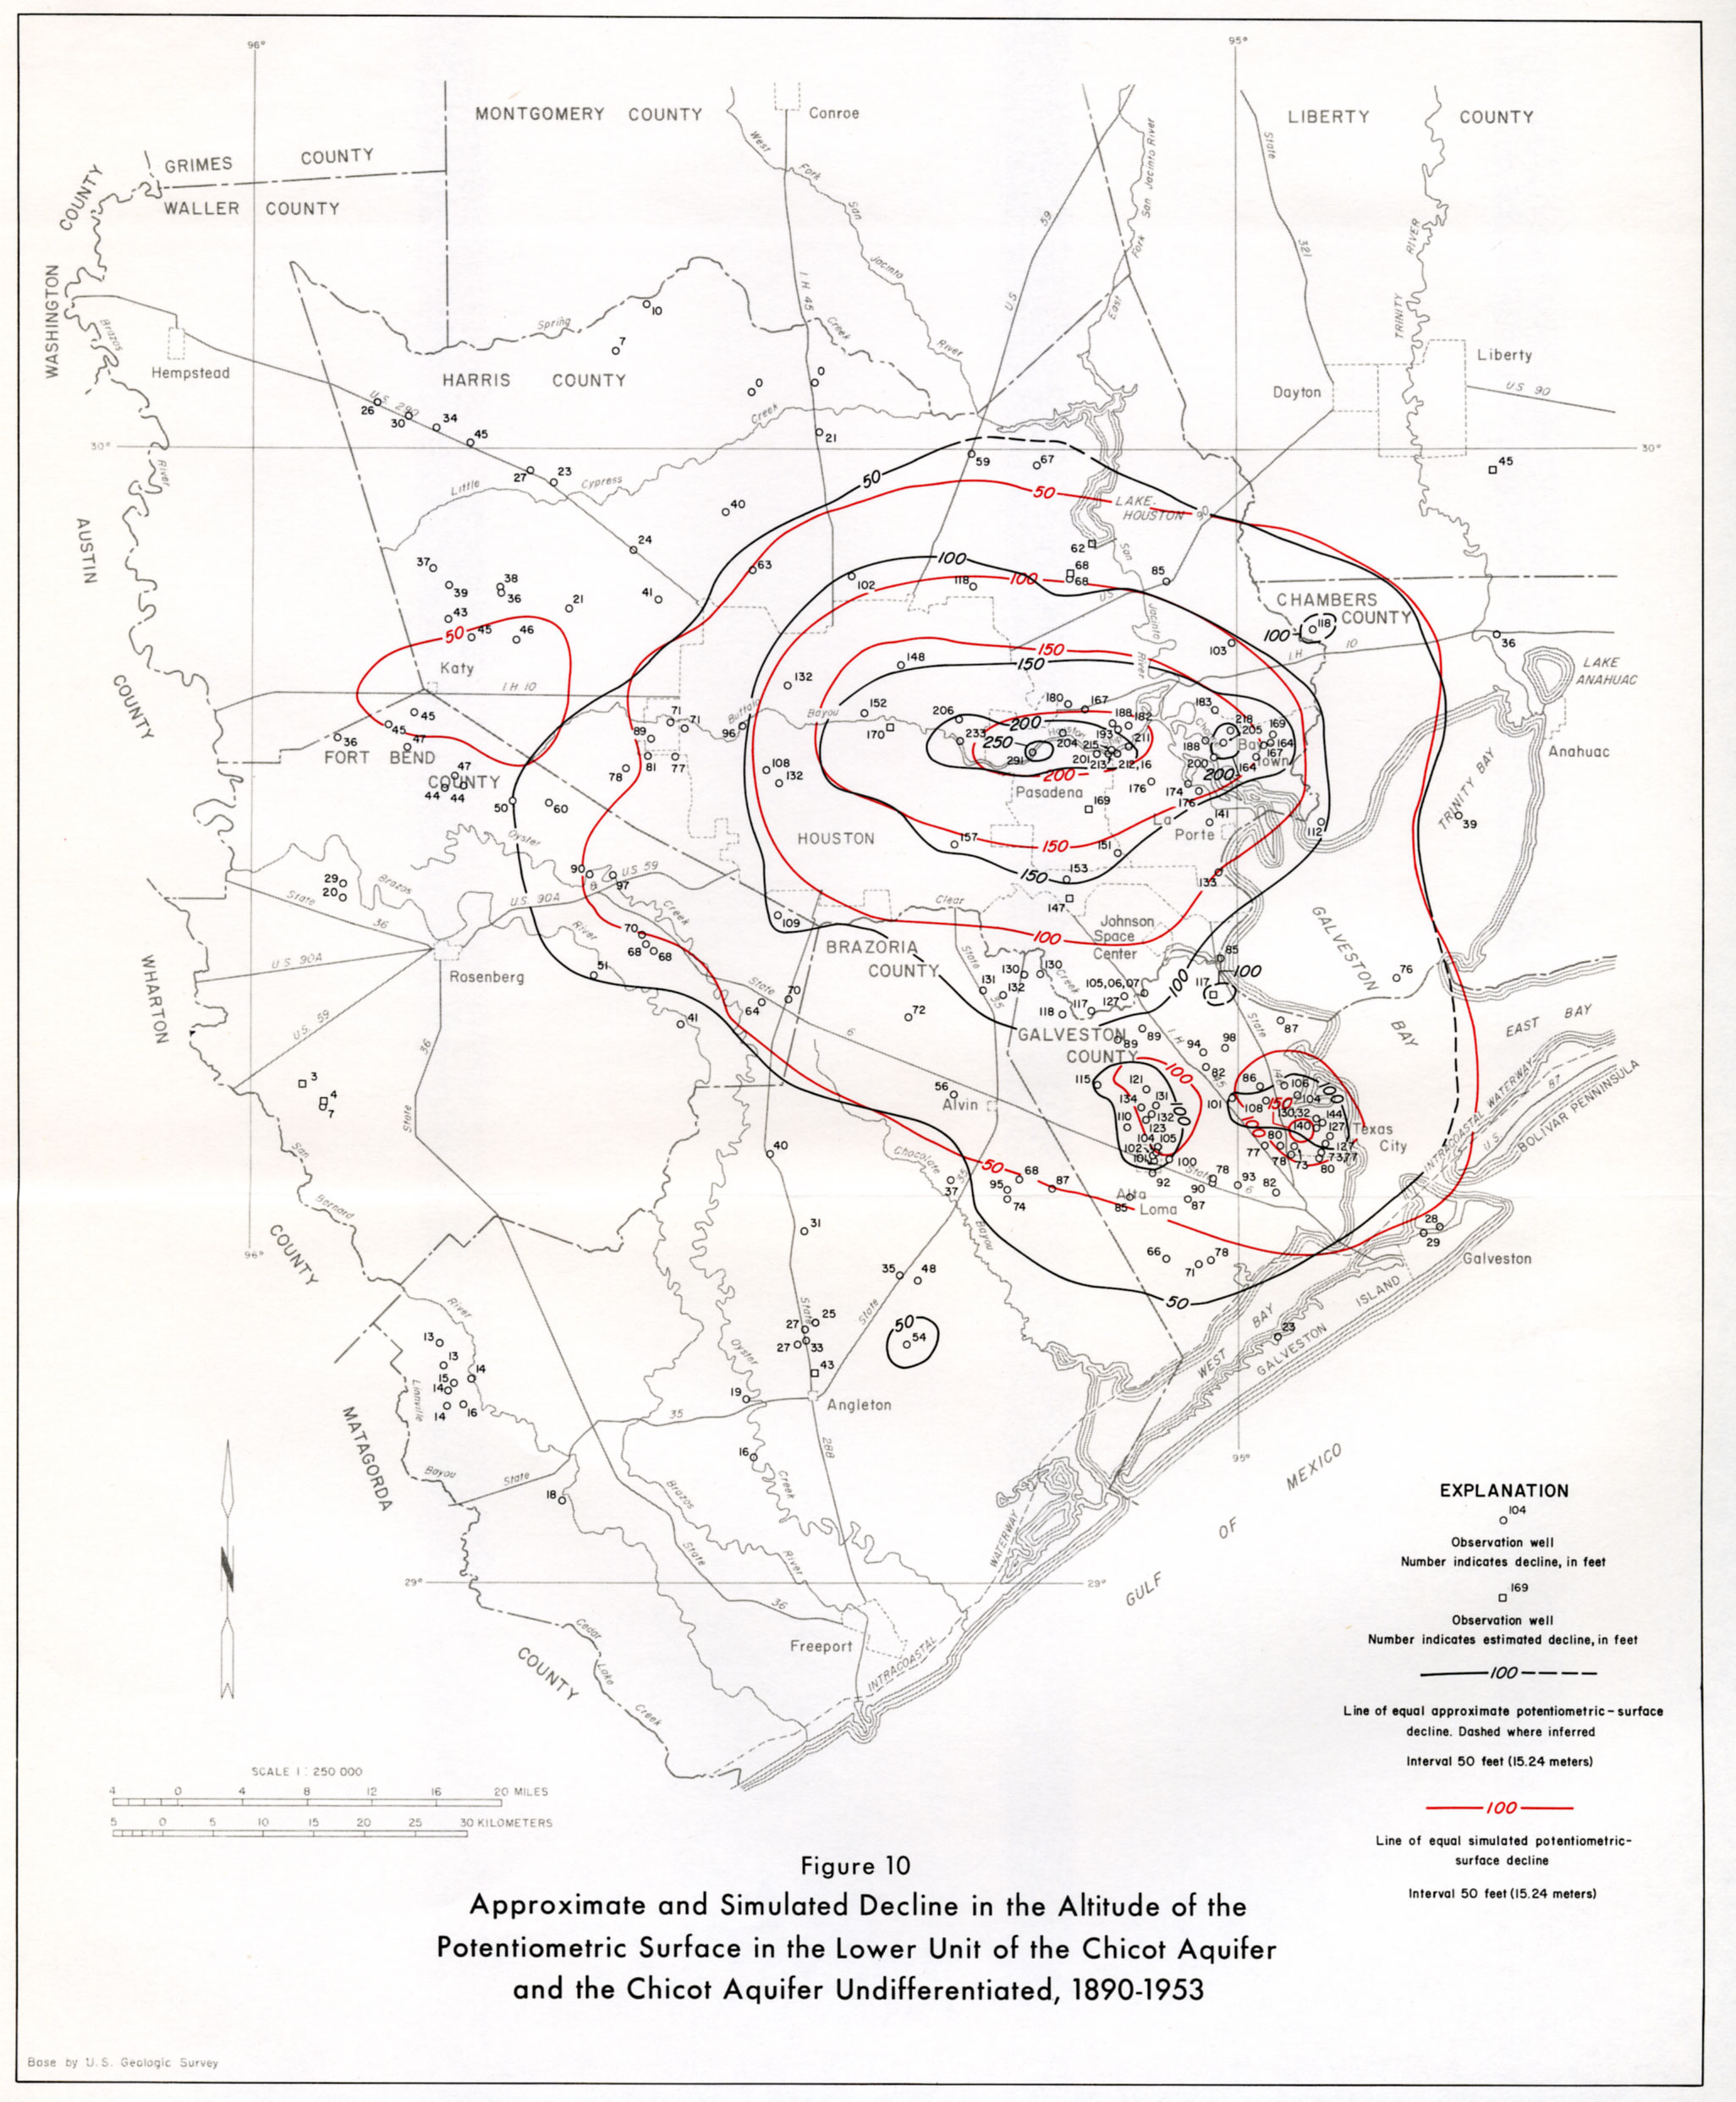
- figure 10 - Approximate and Simulated Decline in the Altitude of the Potentiometric Surface in the Lower Unit of the Chicot Aquifer and the Chicot Aquifer Undifferentiated, 1890-1953
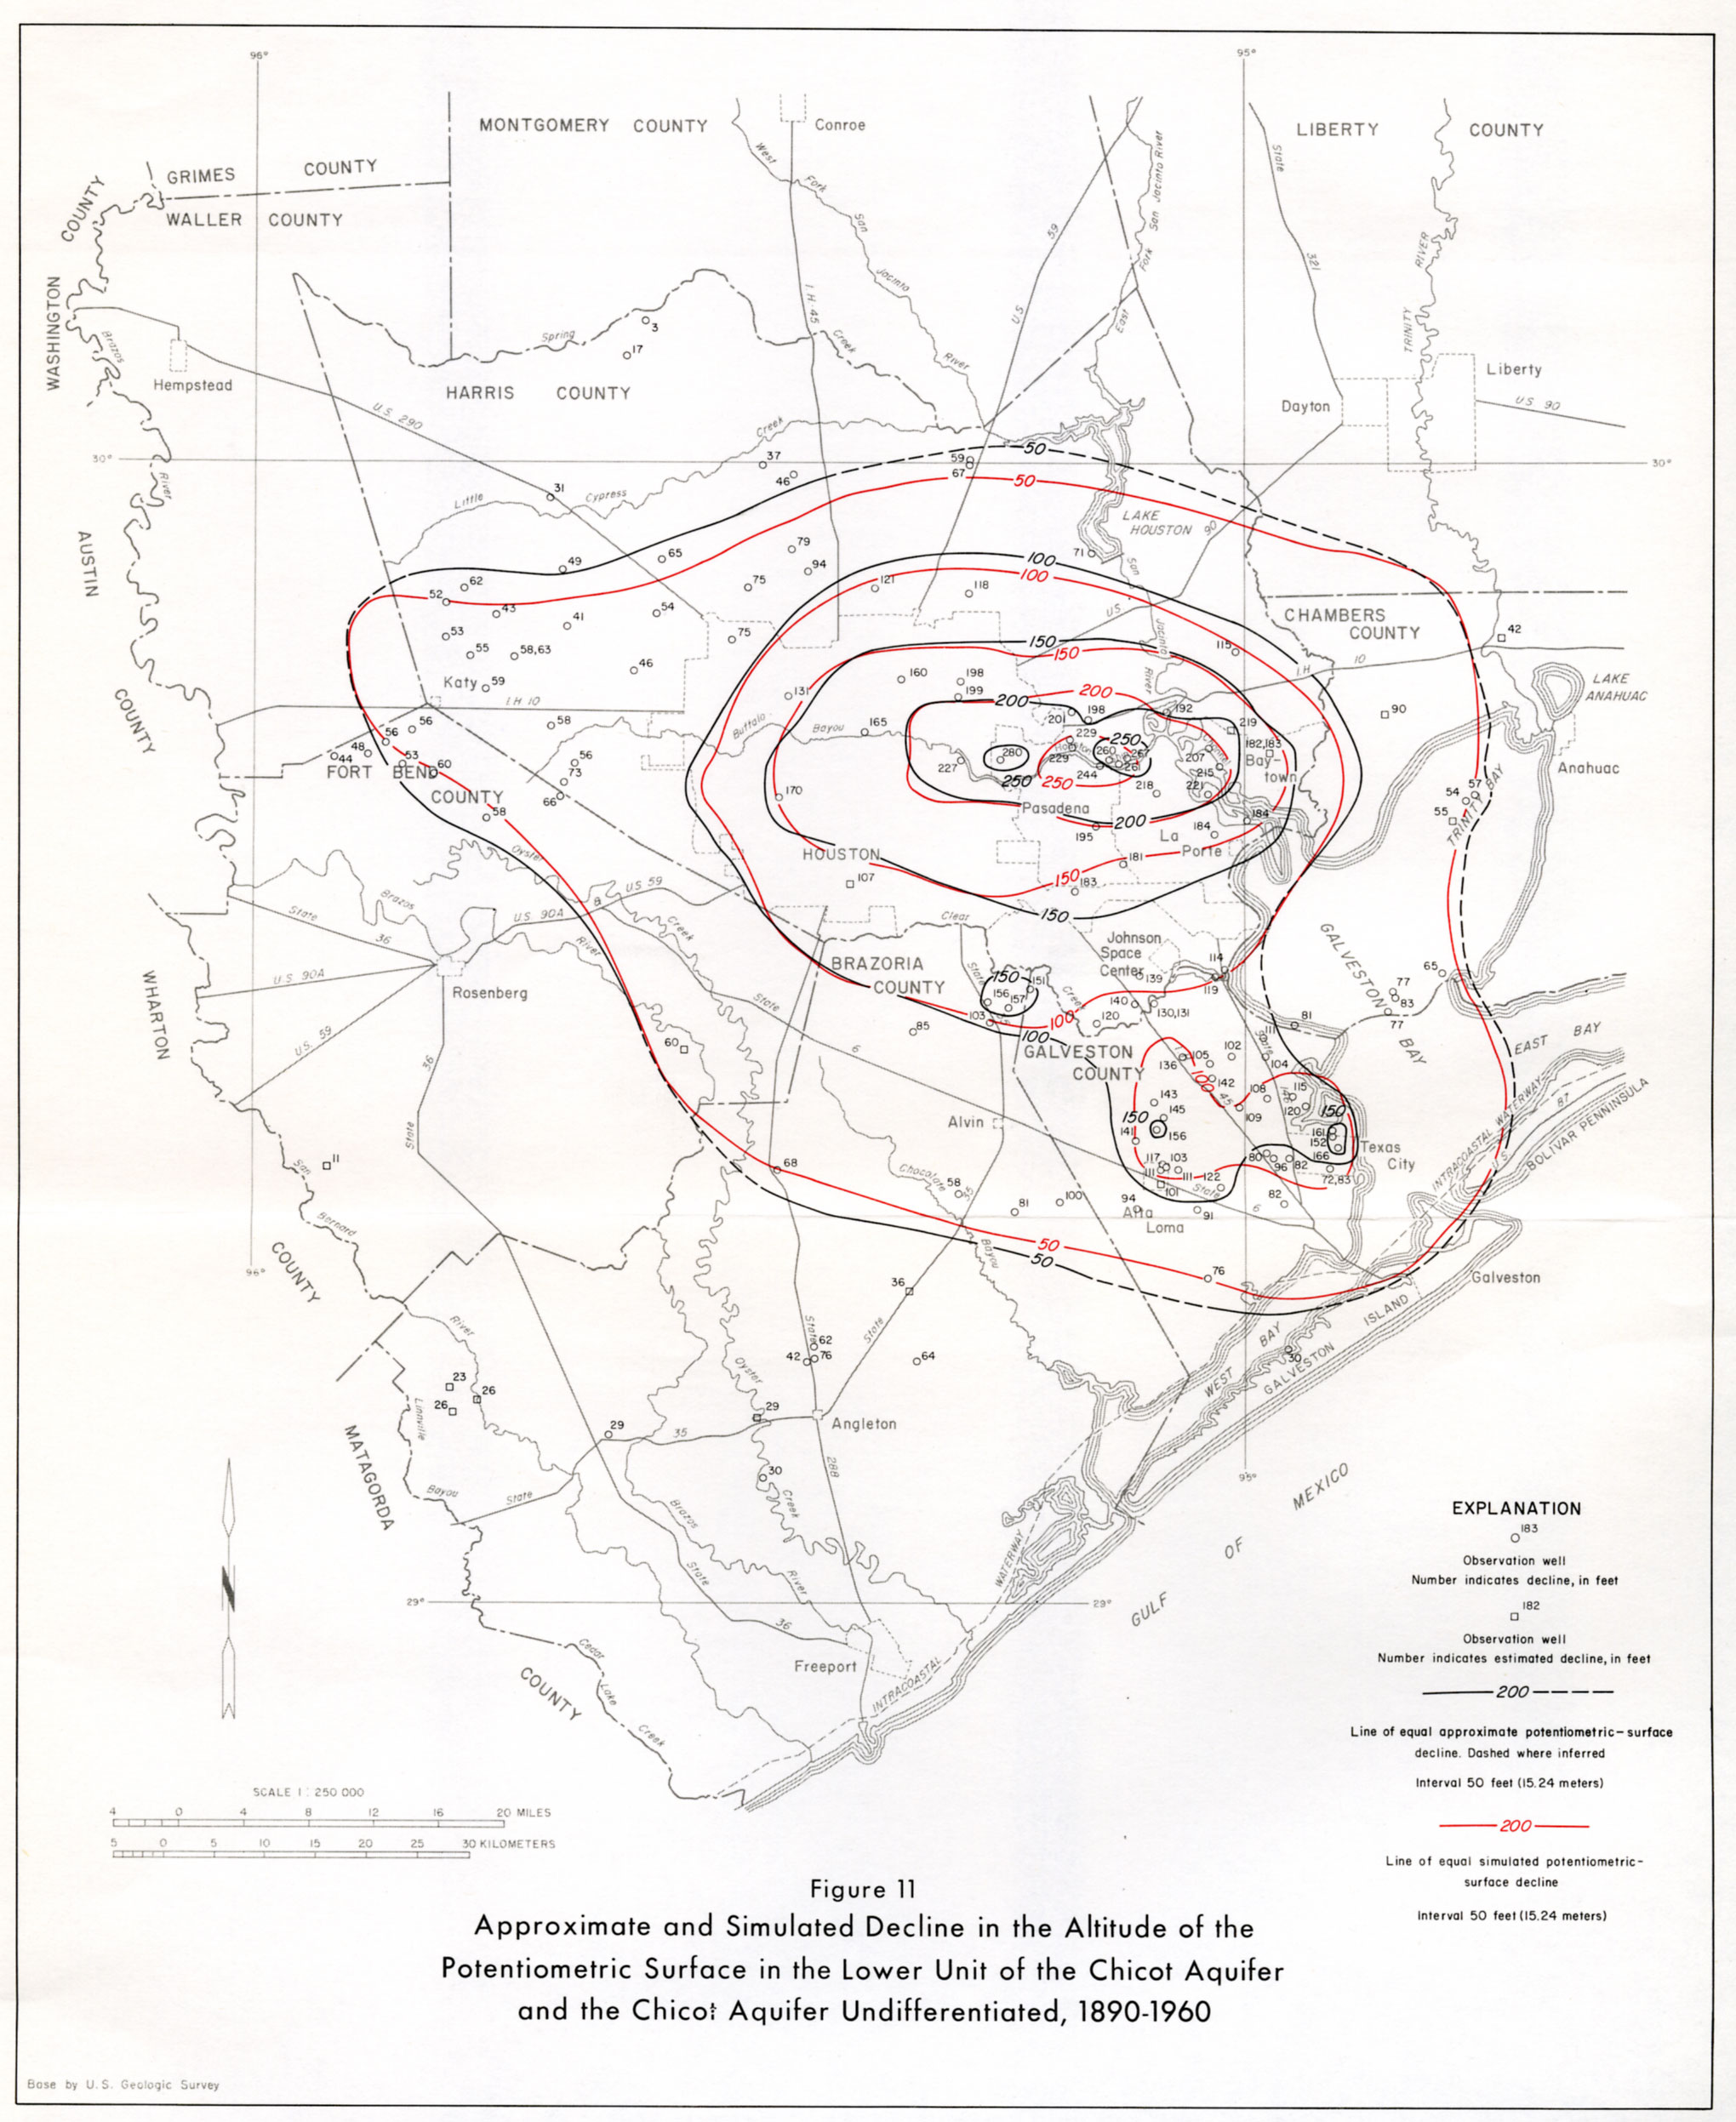
- figure 11 - Approximate and Simulated Decline in the Altitude of the Potentiometric Surface in the Lower Unit of the Chicot Aquifer and the Chicot Aquifer Undifferentiated, 1890-1960
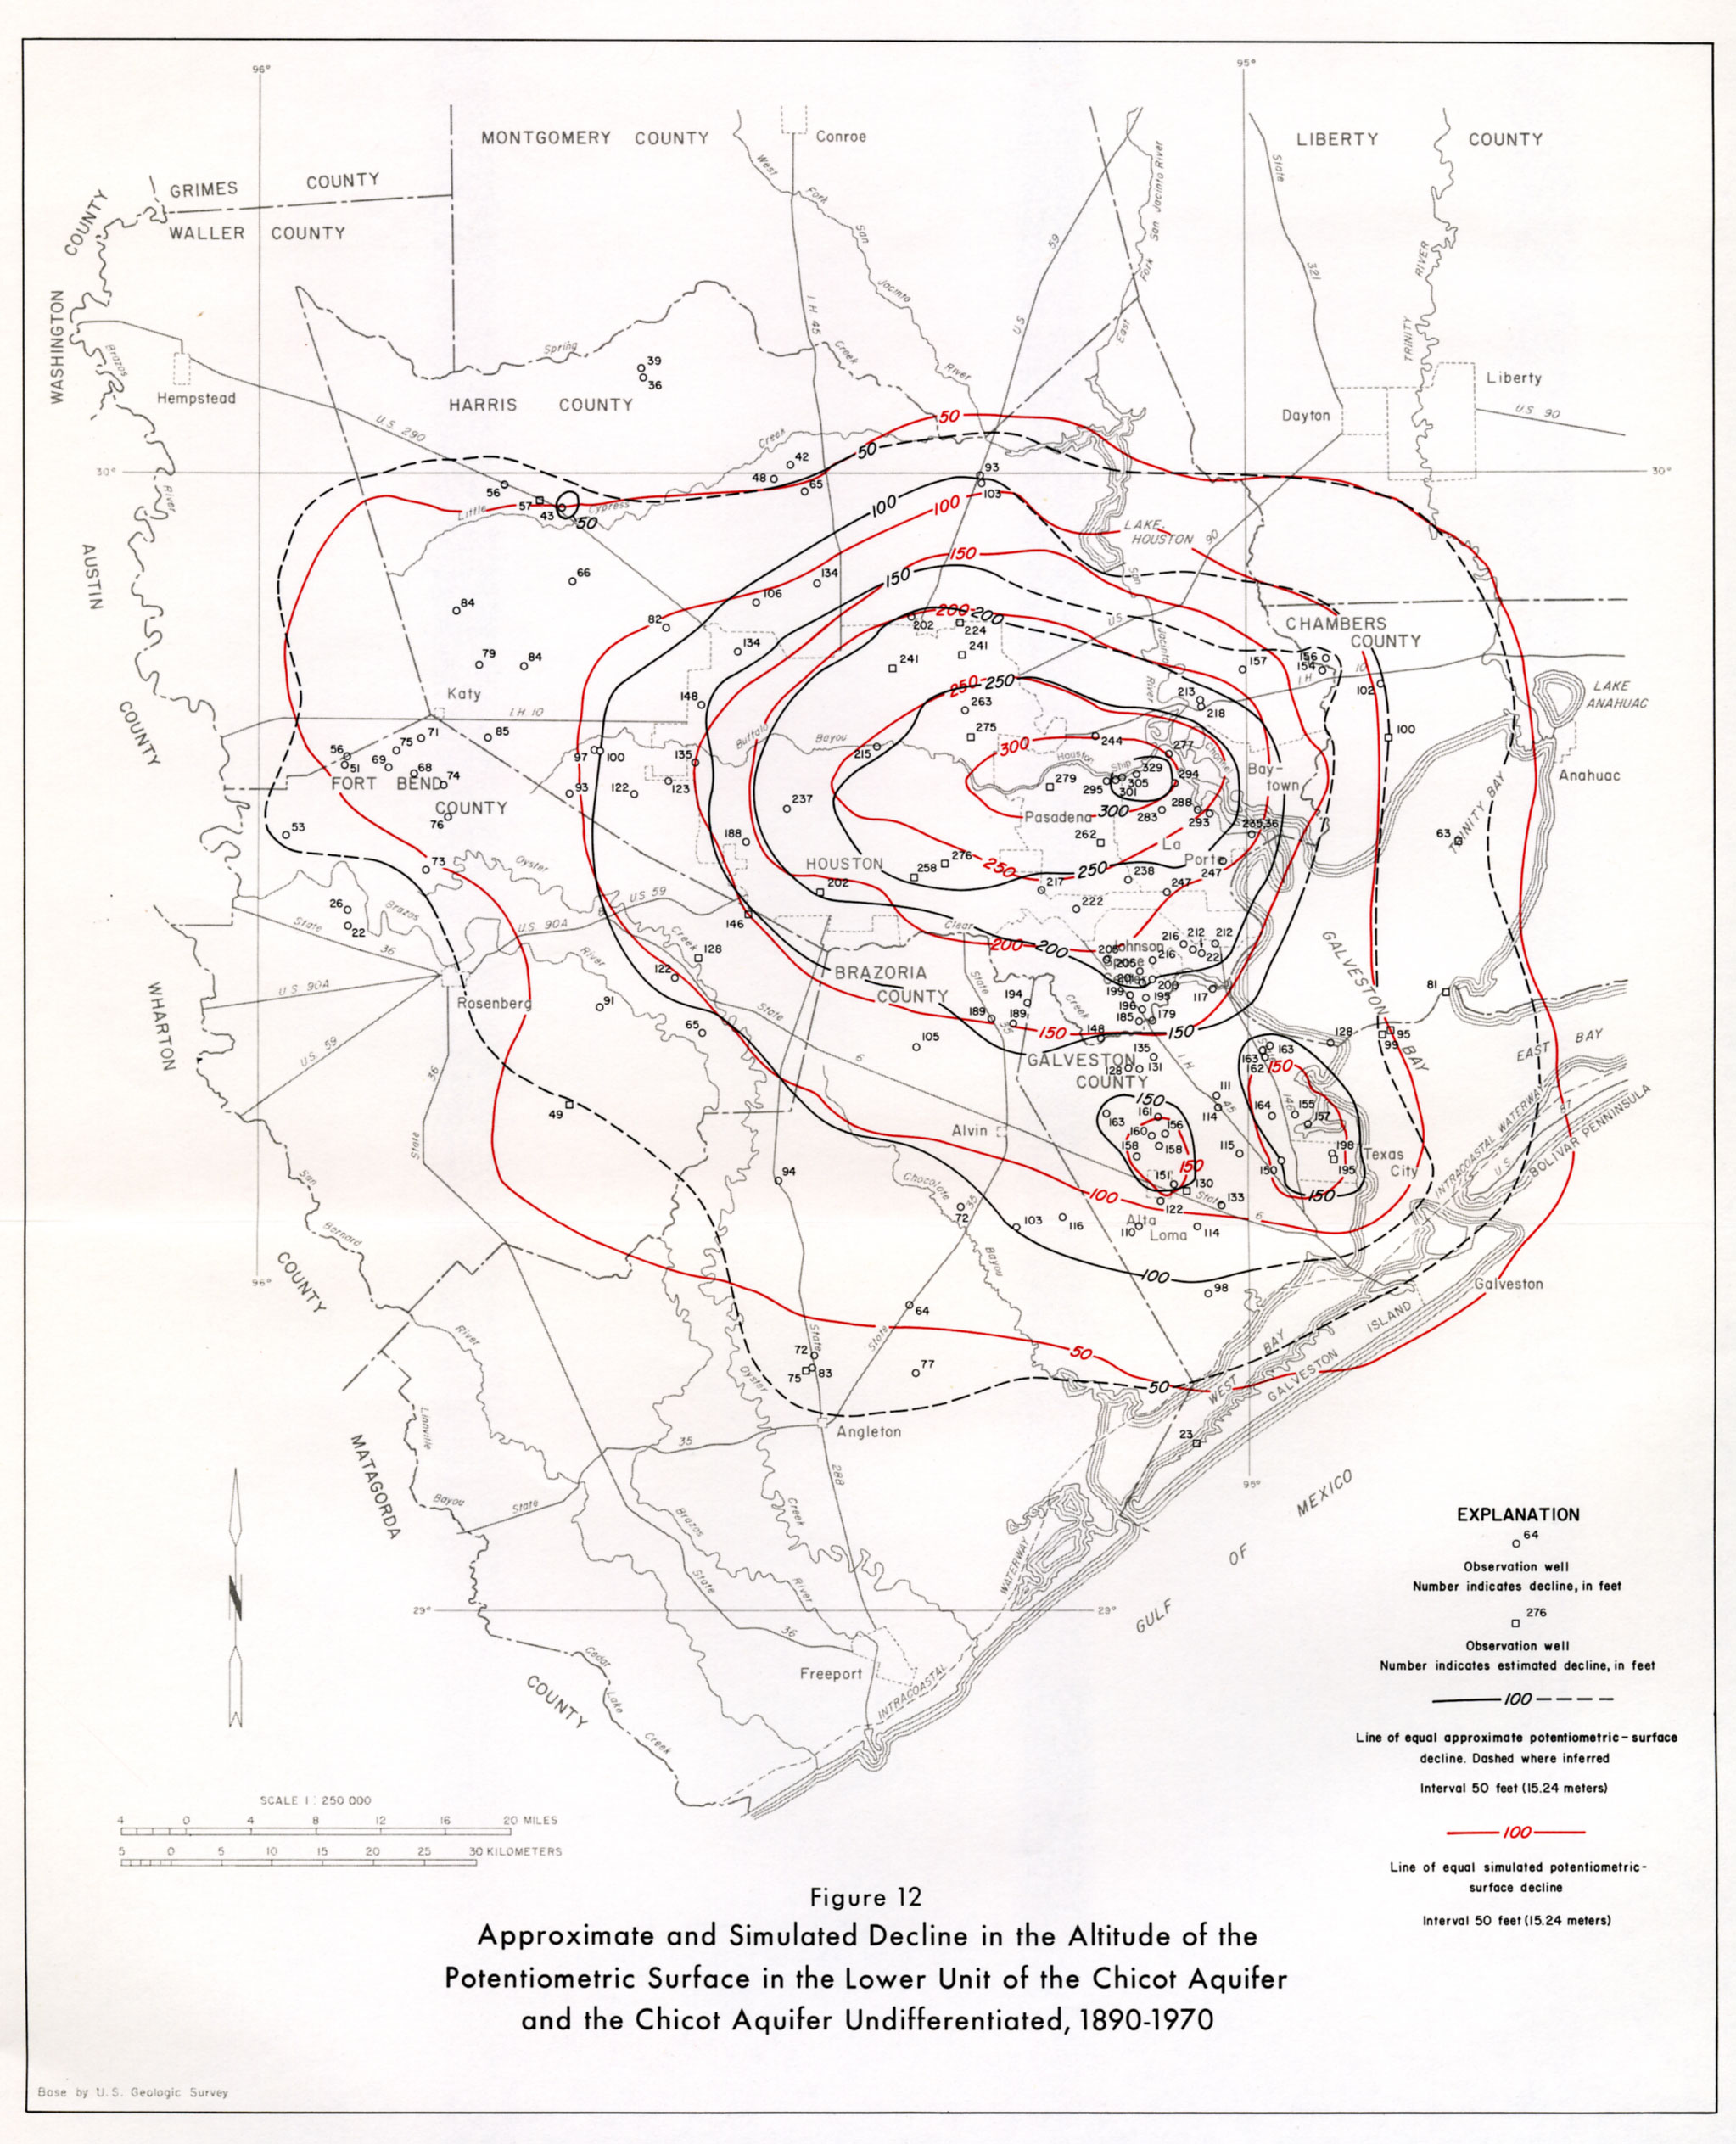
- figure 12 - Approximate and Simulated Decline in the Altitude of the Potentiometric Surface in the Lower Unit of the Chicot Aquifer and the Chicot Aquifer Undifferentiated, 1890-1970
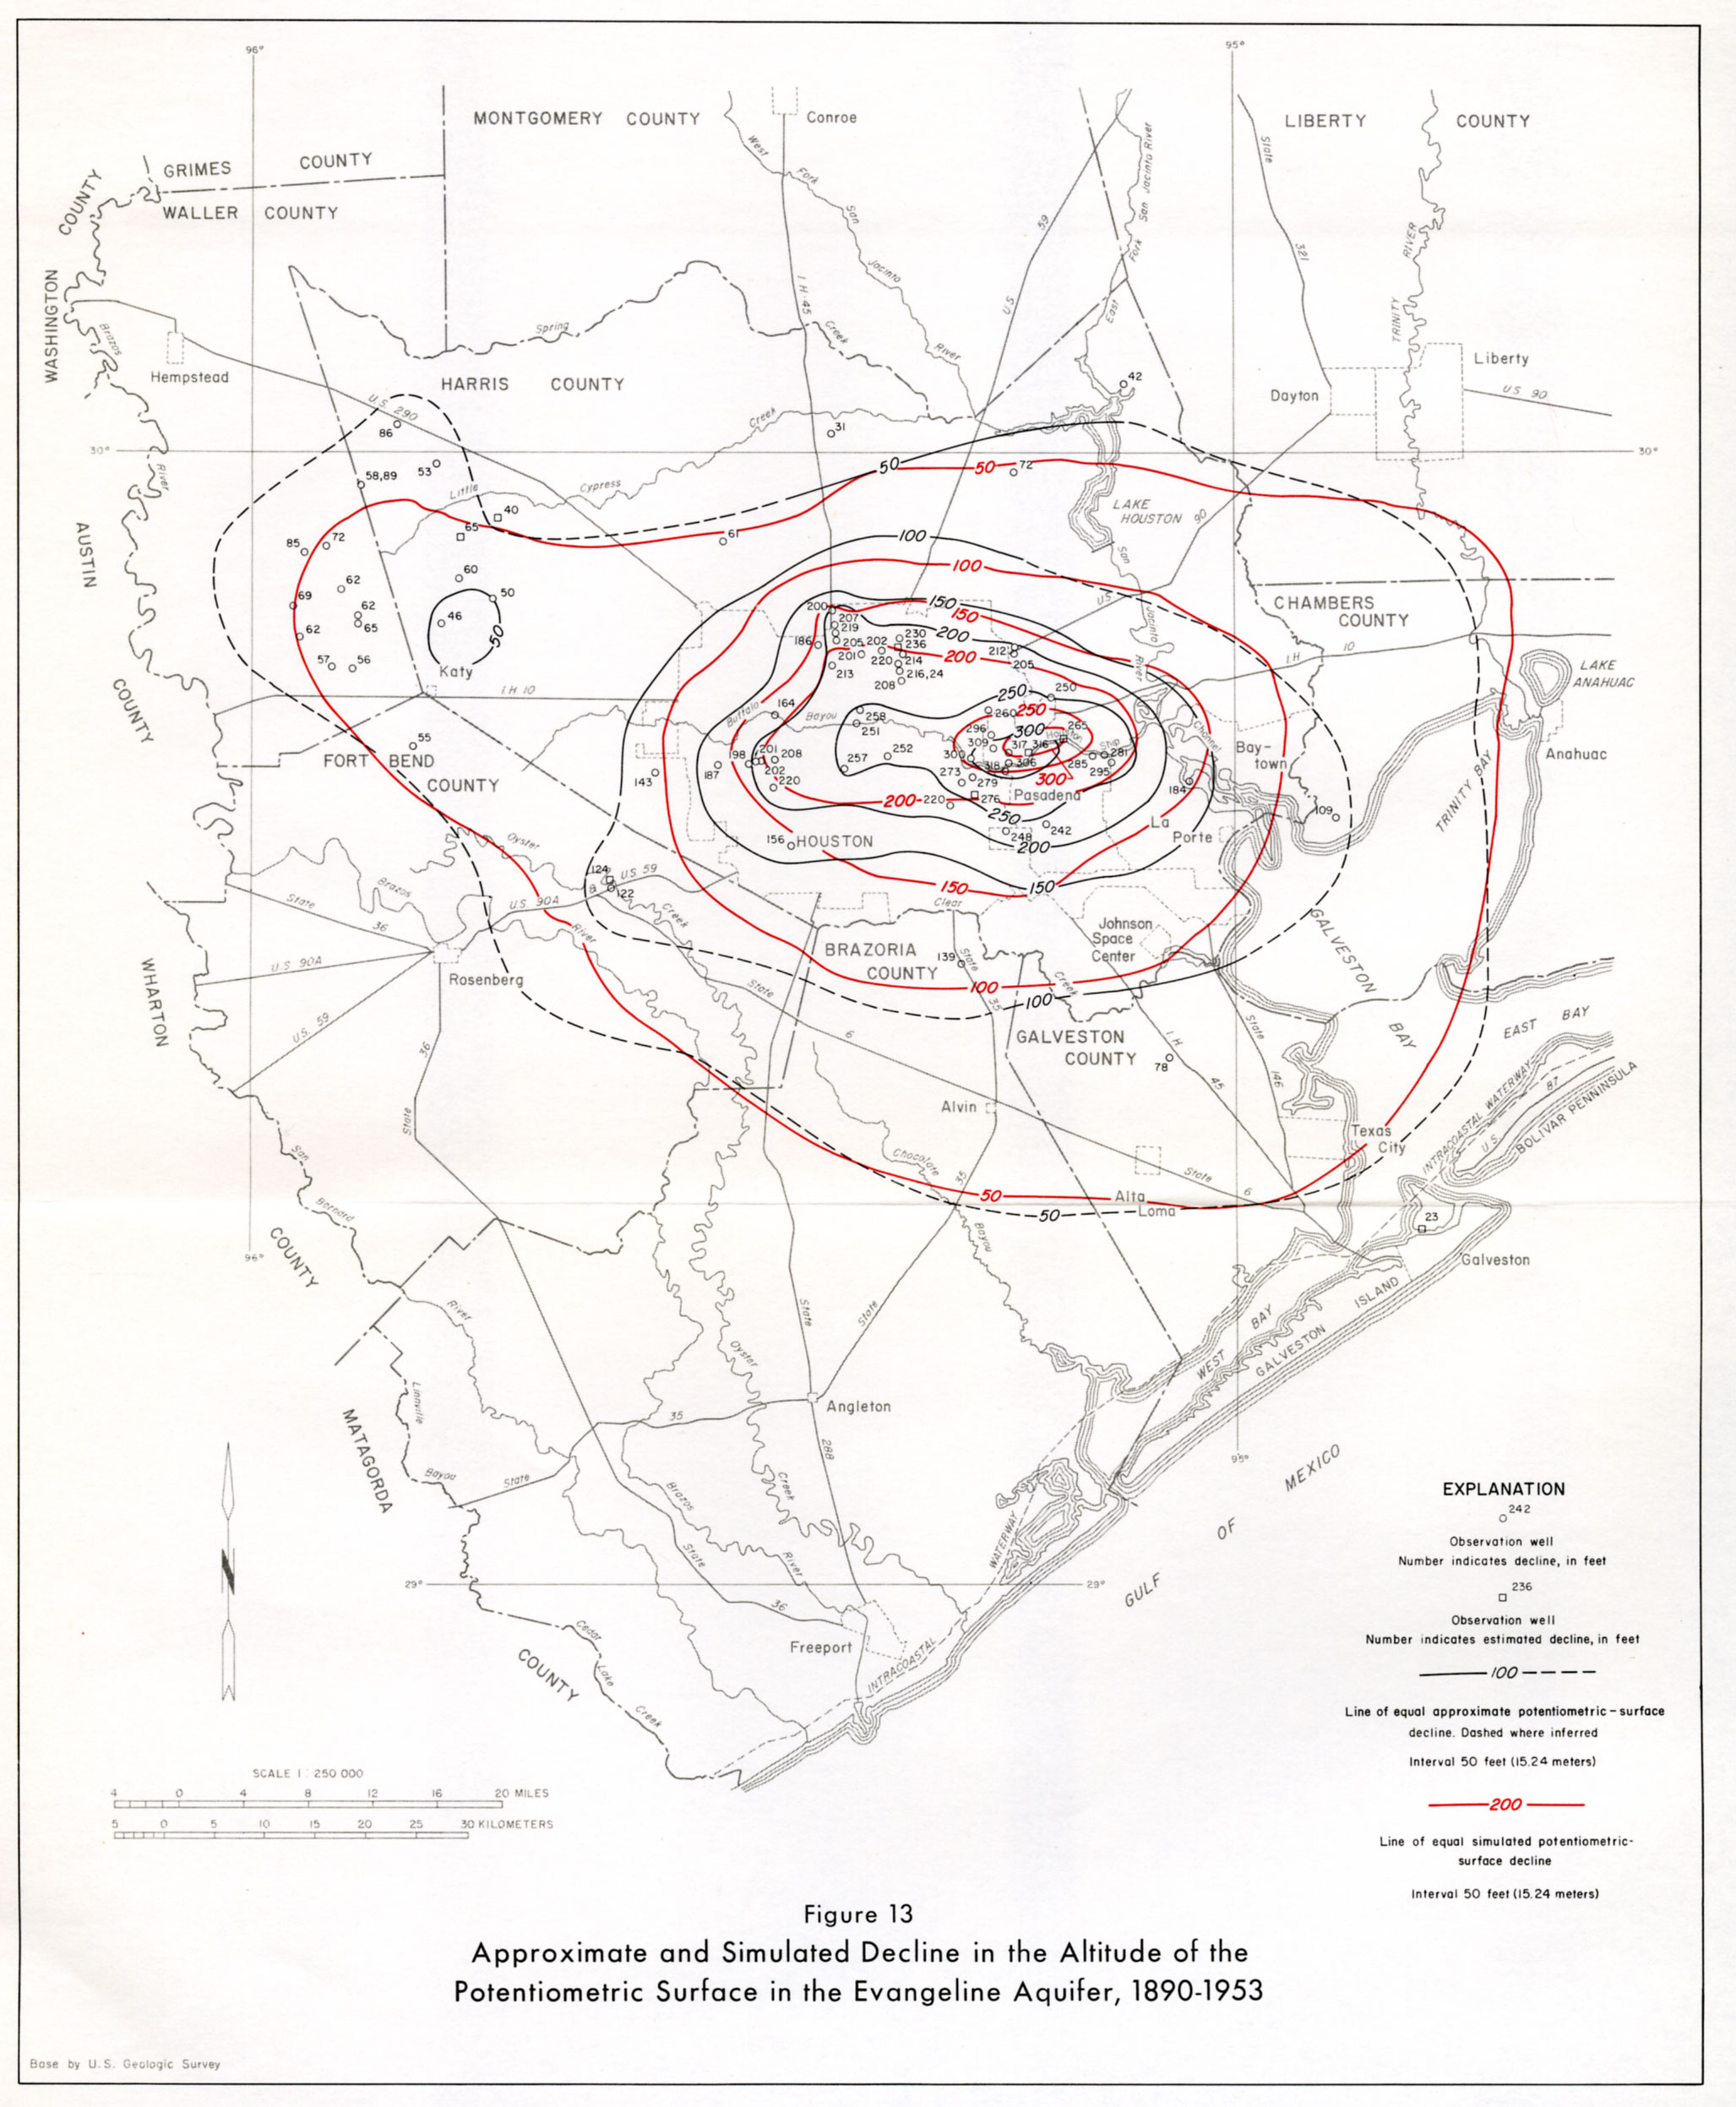
- figure 13 - Approximate and Simulated Decline in the Altitude of the Potentiometric Surface in the Evangeline Aquifer, 1890-1953
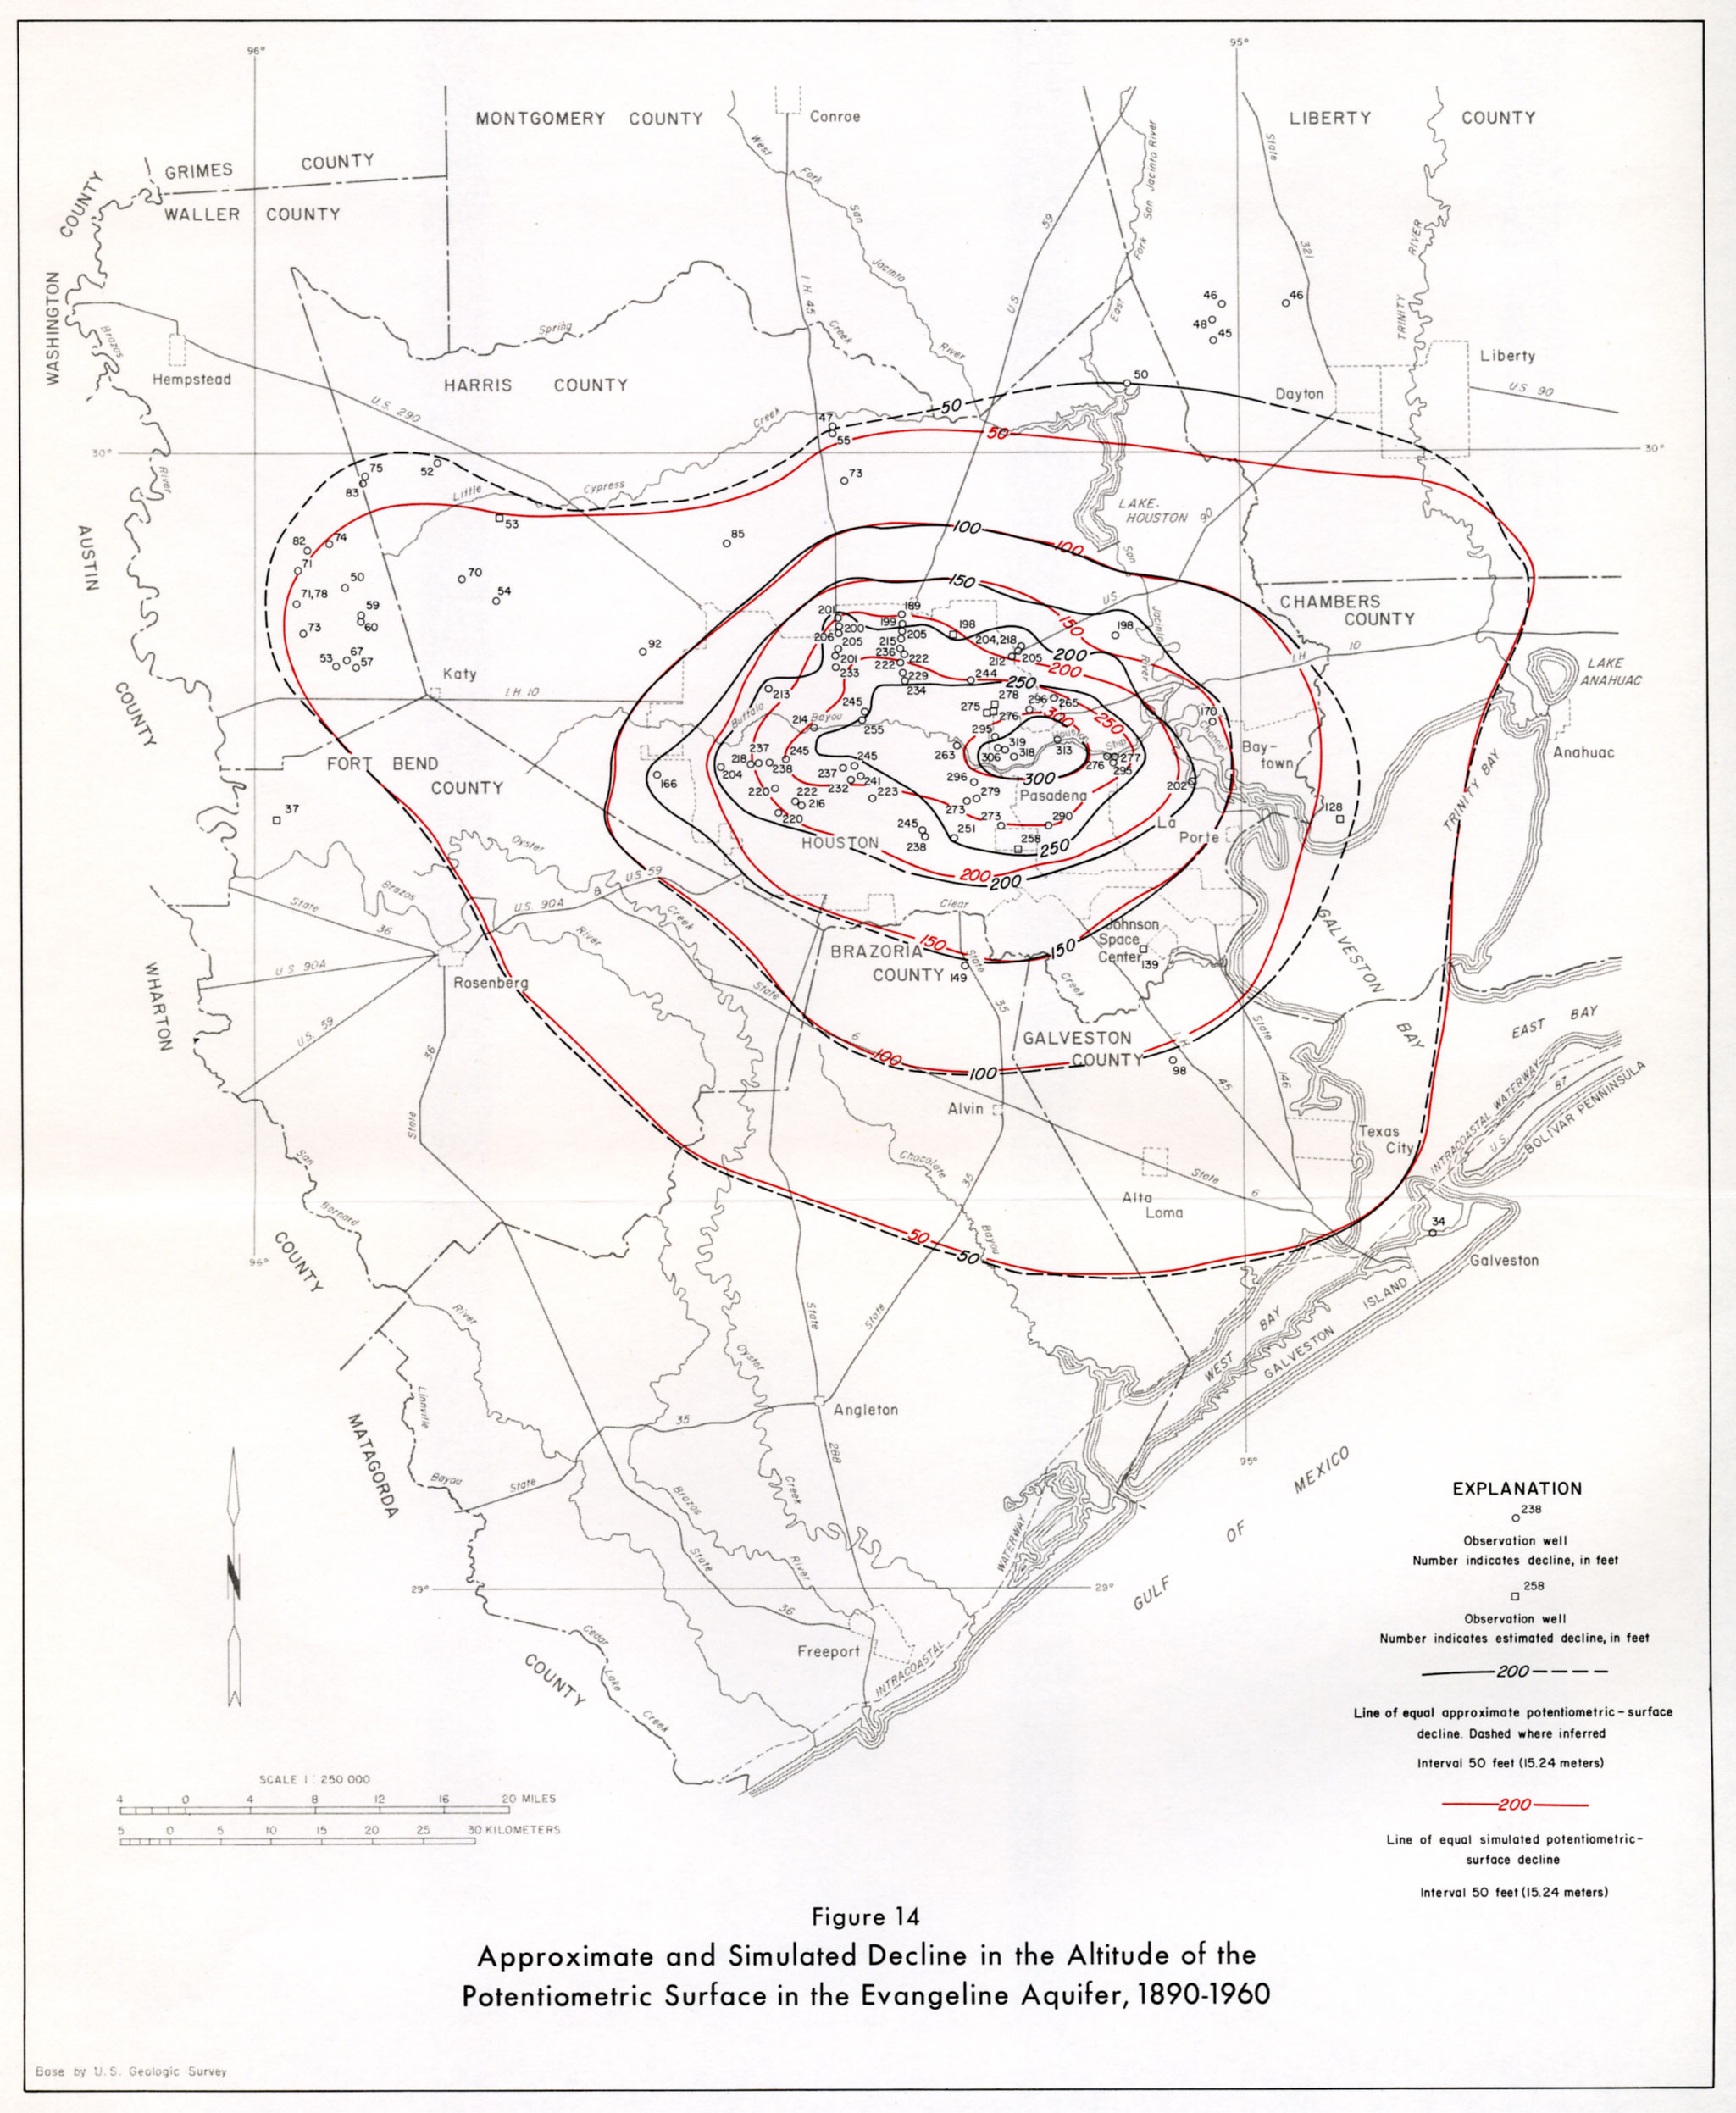
- figure 14 - Approximate and Simulated Decline in the Altitude of the Potentiometric Surface in the Evangeline Aquifer, 1890-1960
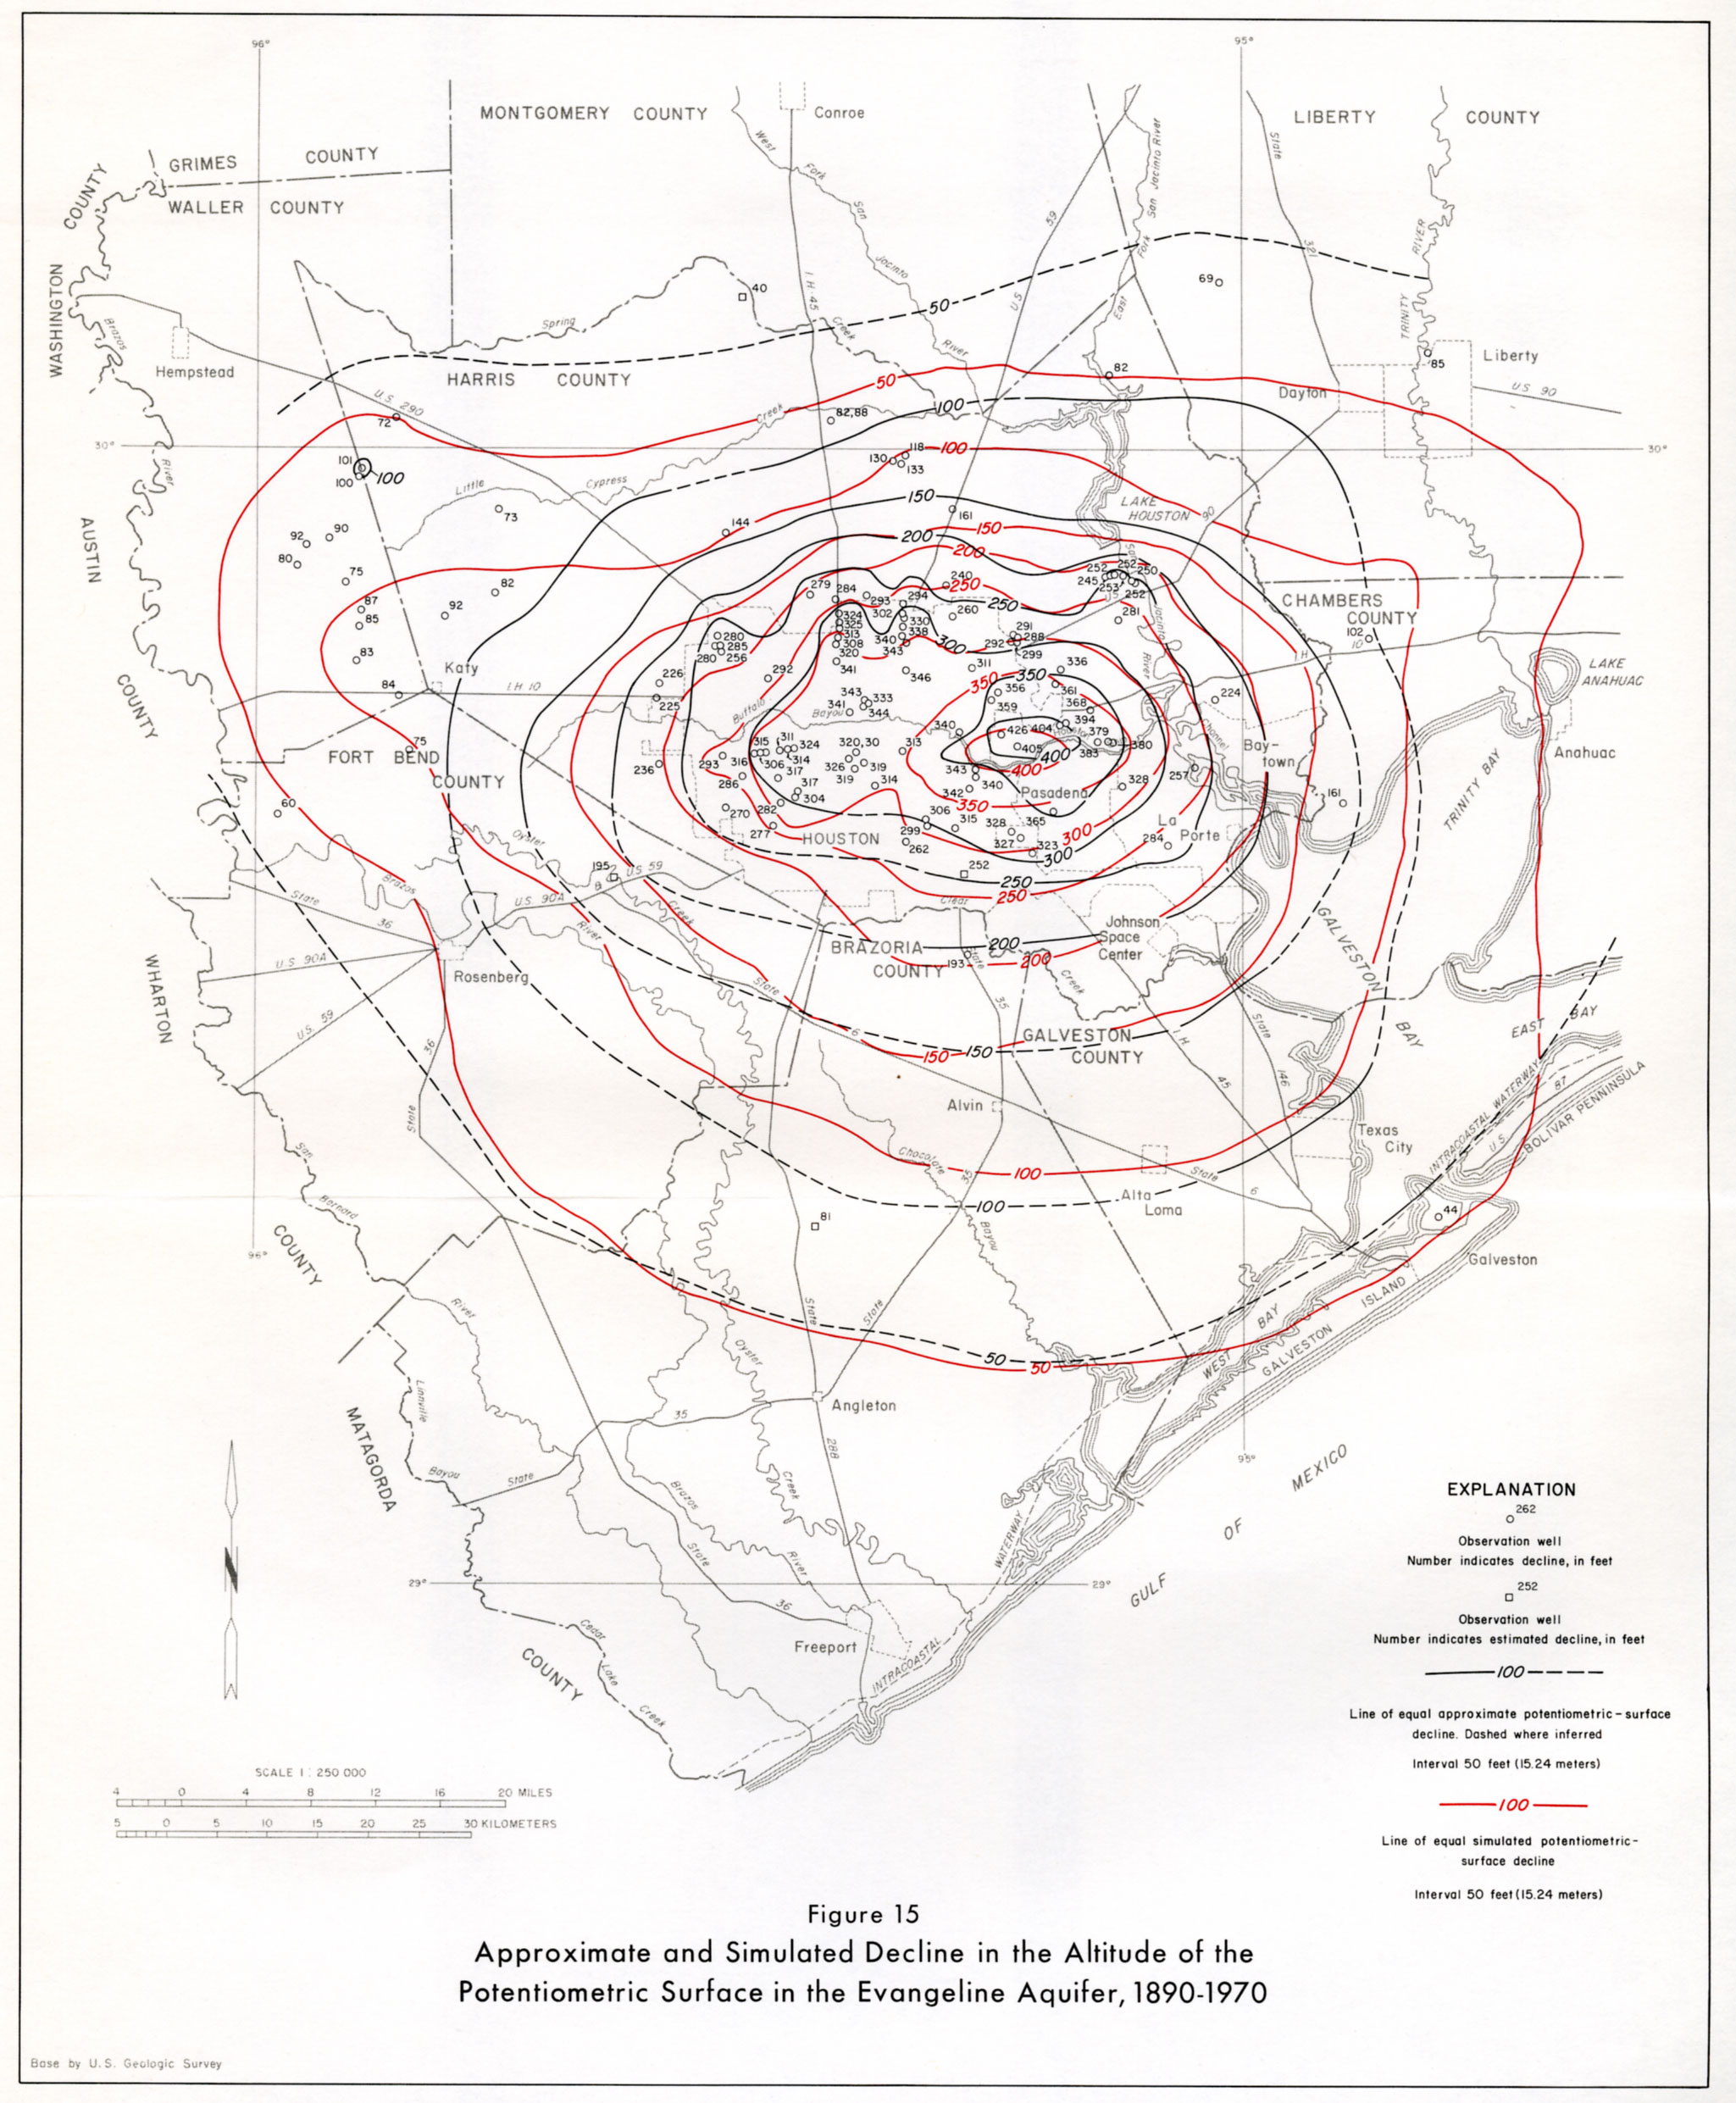
- figure 15 - Approximate and Simulated Decline in the Altitude of the Potentiometric Surface in the Evangeline Aquifer, 1890-1970
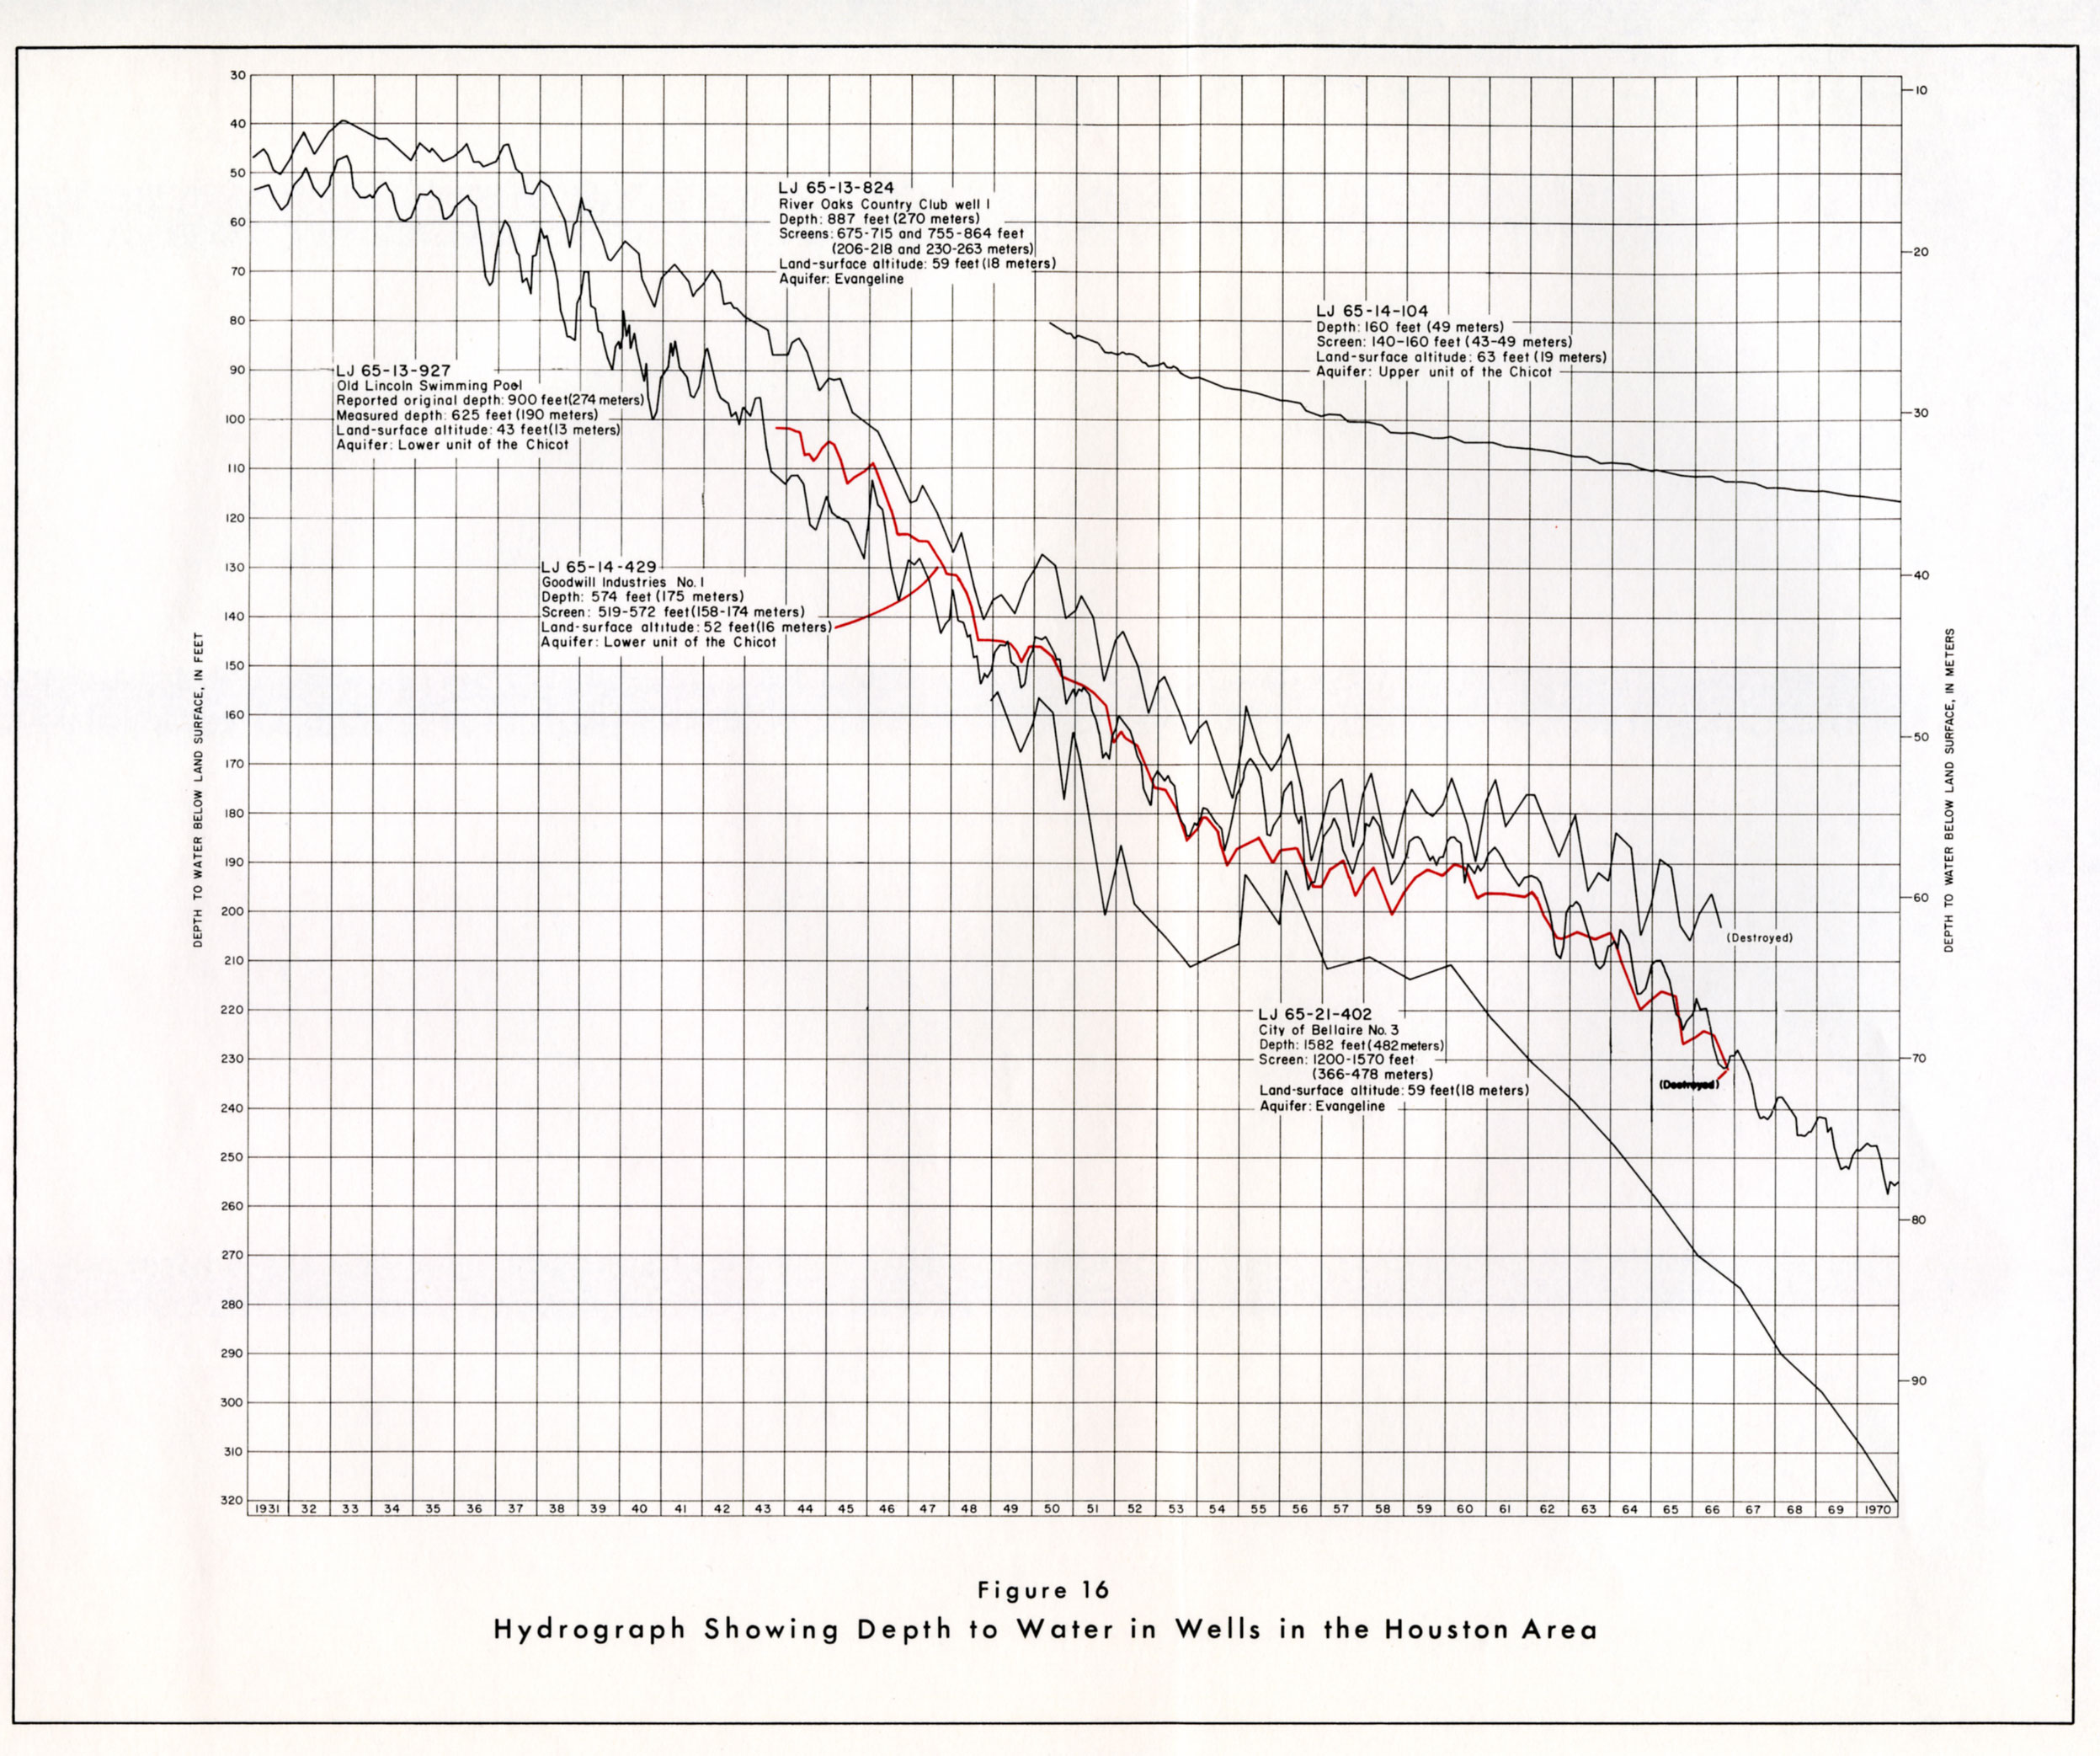
- figure 16 - Hydrograph Showing Depth to Water in Wells in the Houston Area
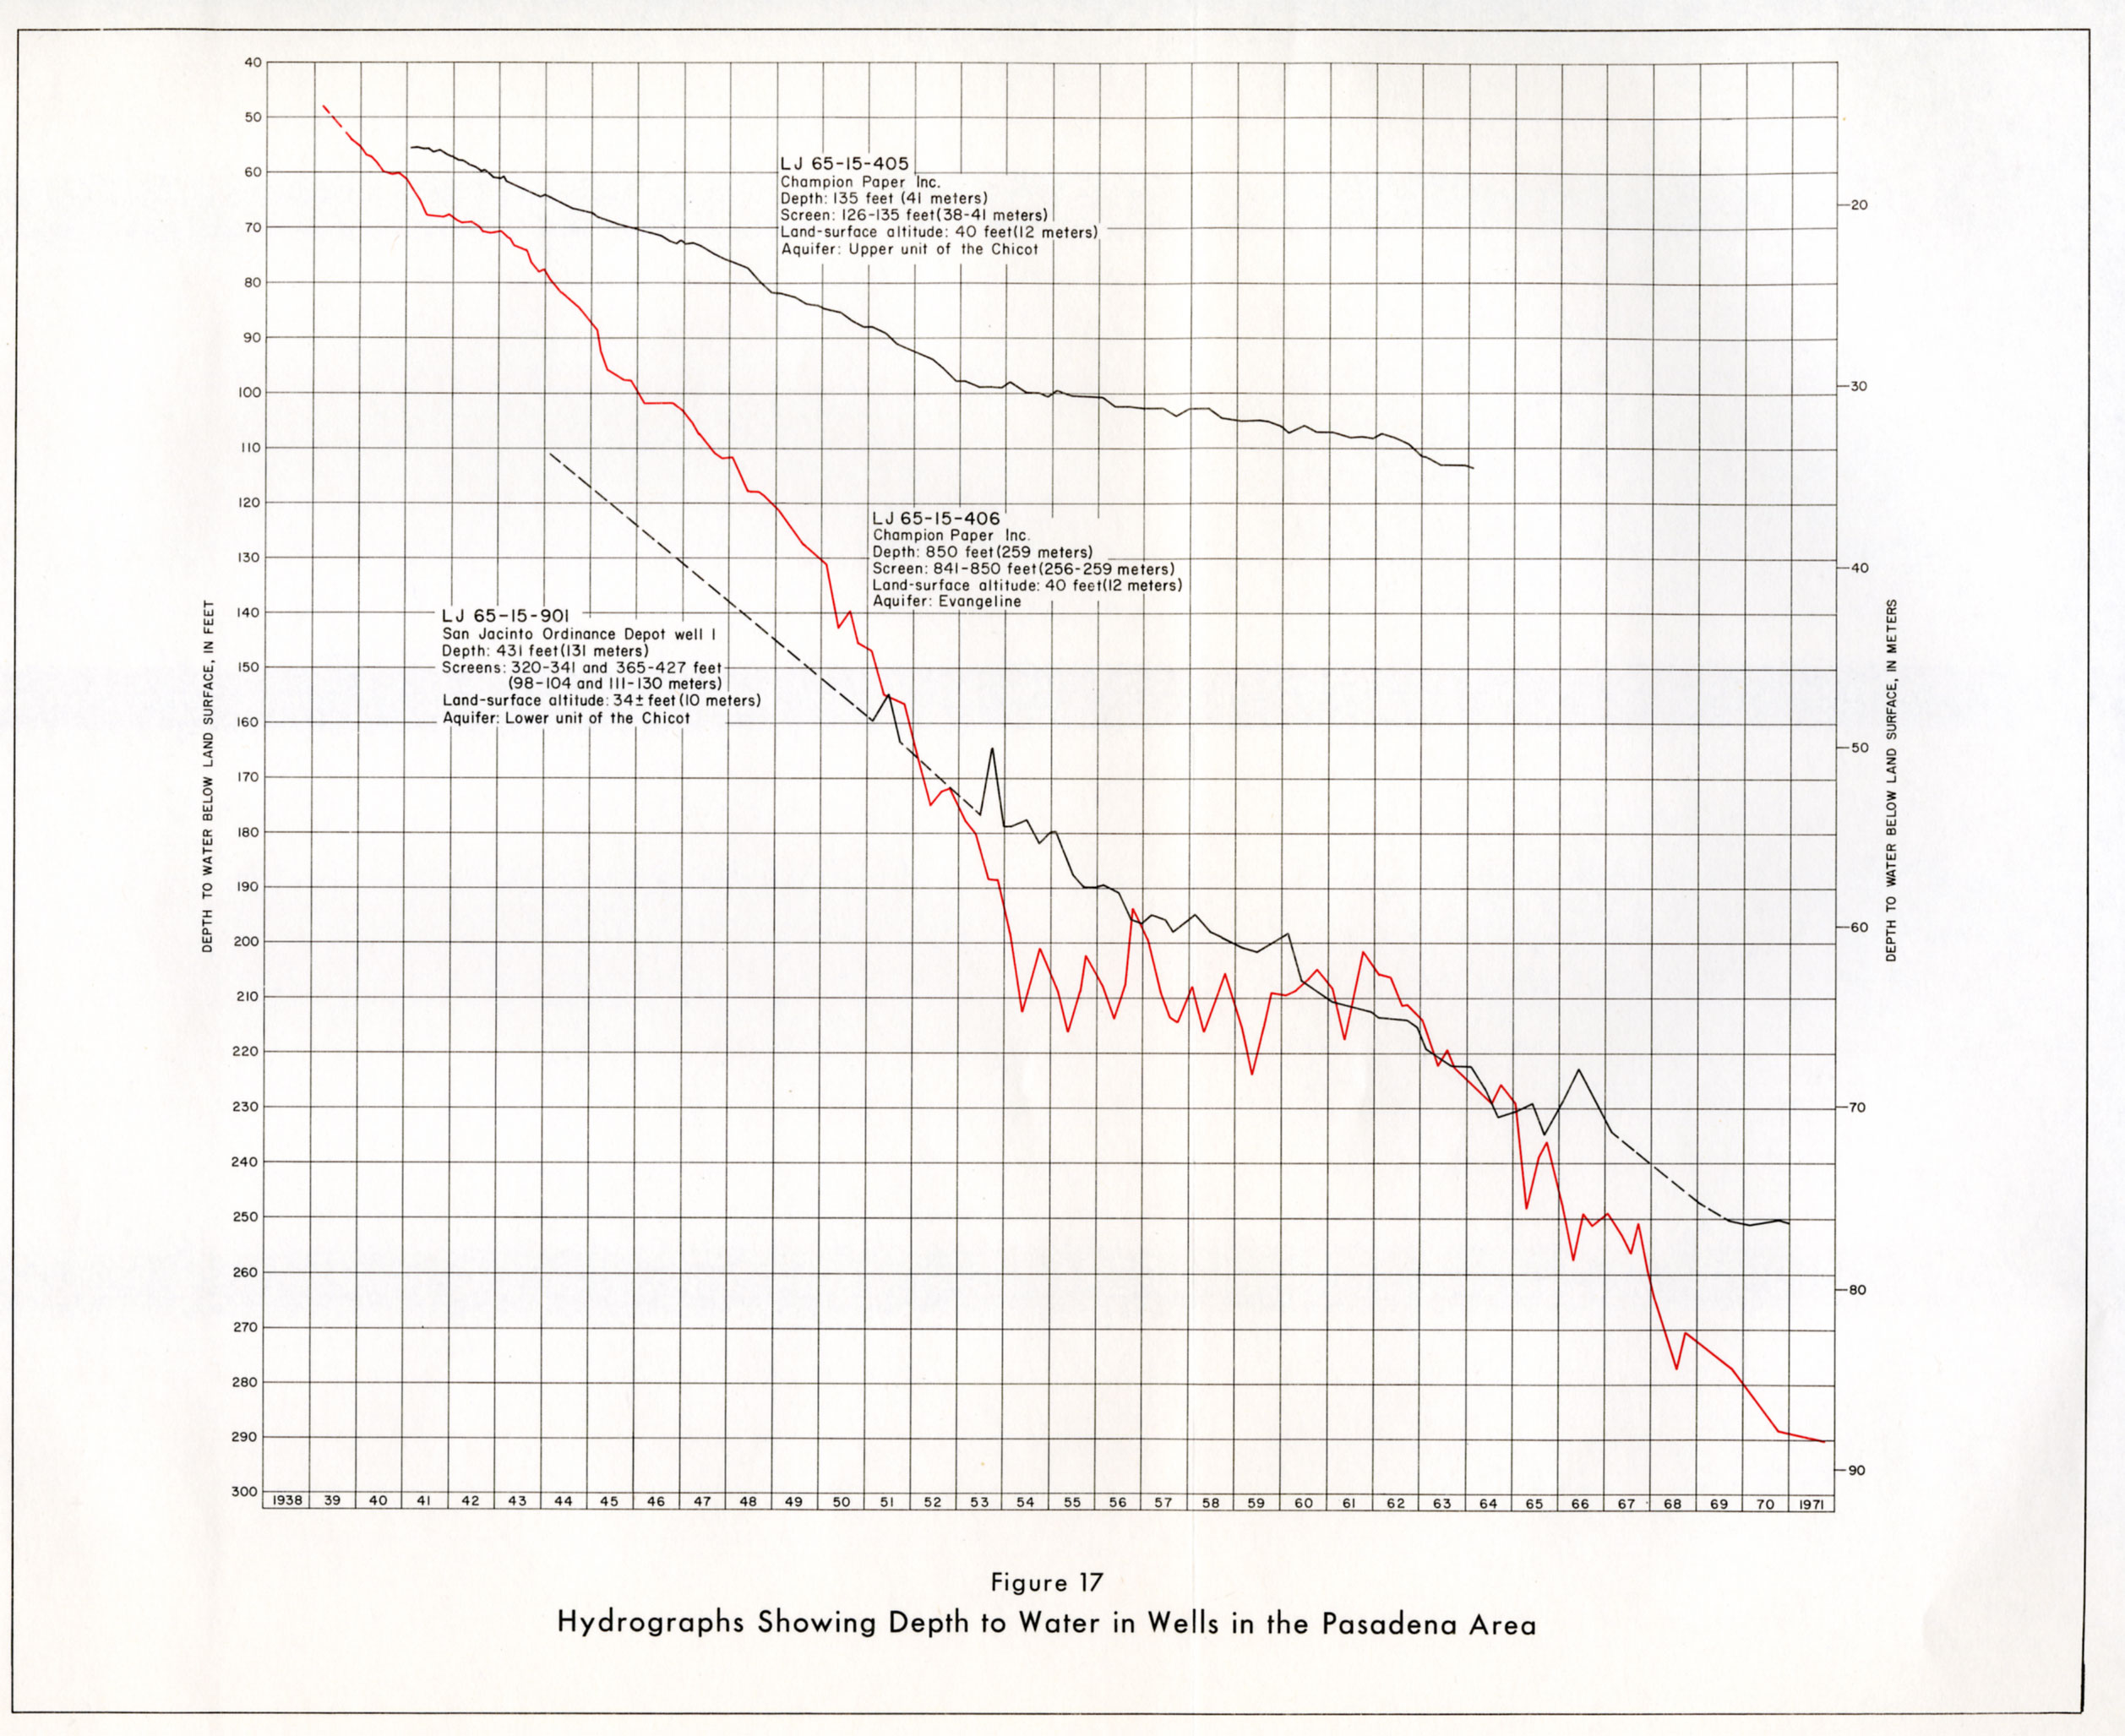
- figure 17 - Hydrograph Showing Depth to Water in Wells in the Pasadena Area
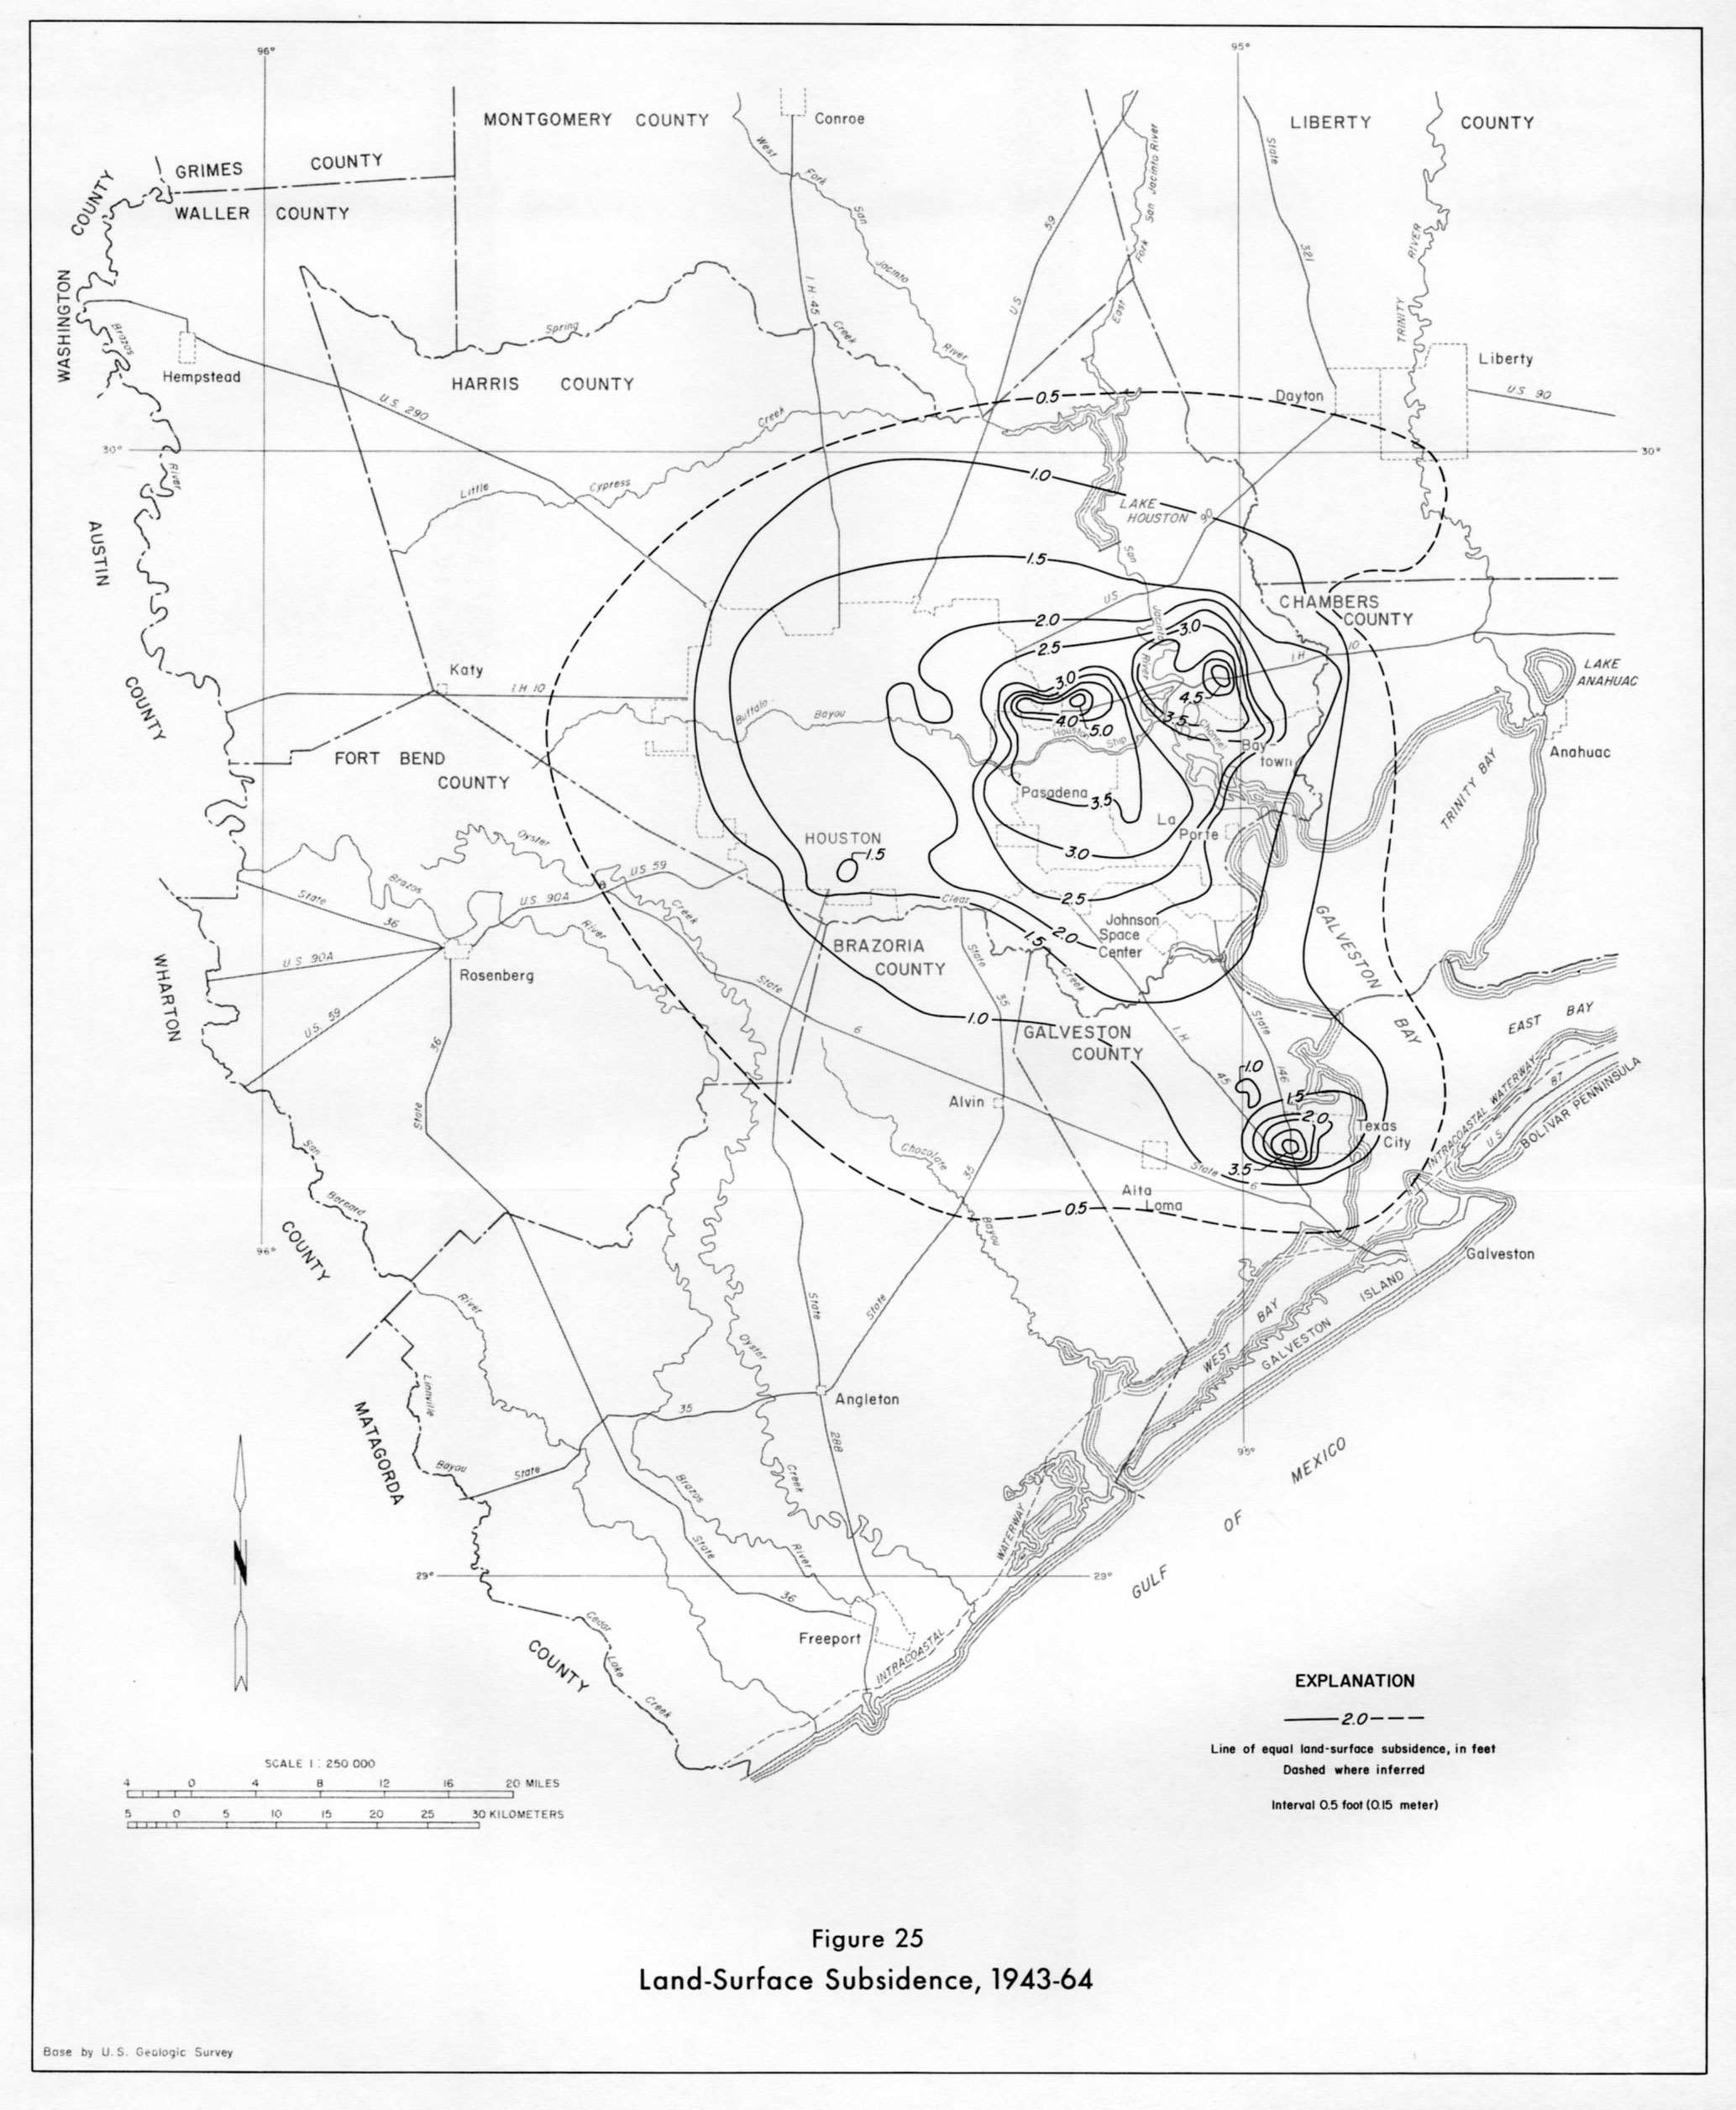
- figure 25 - Land-Surface Subsidence, 1943-64
- figure 31 - Simulated Decline in the Altitude of the Potentiometric Surface in the Lower Unit of the Chicot Aquifer and the Chicot Aquifer Undifferentiated, 1890-1980, Alternative A
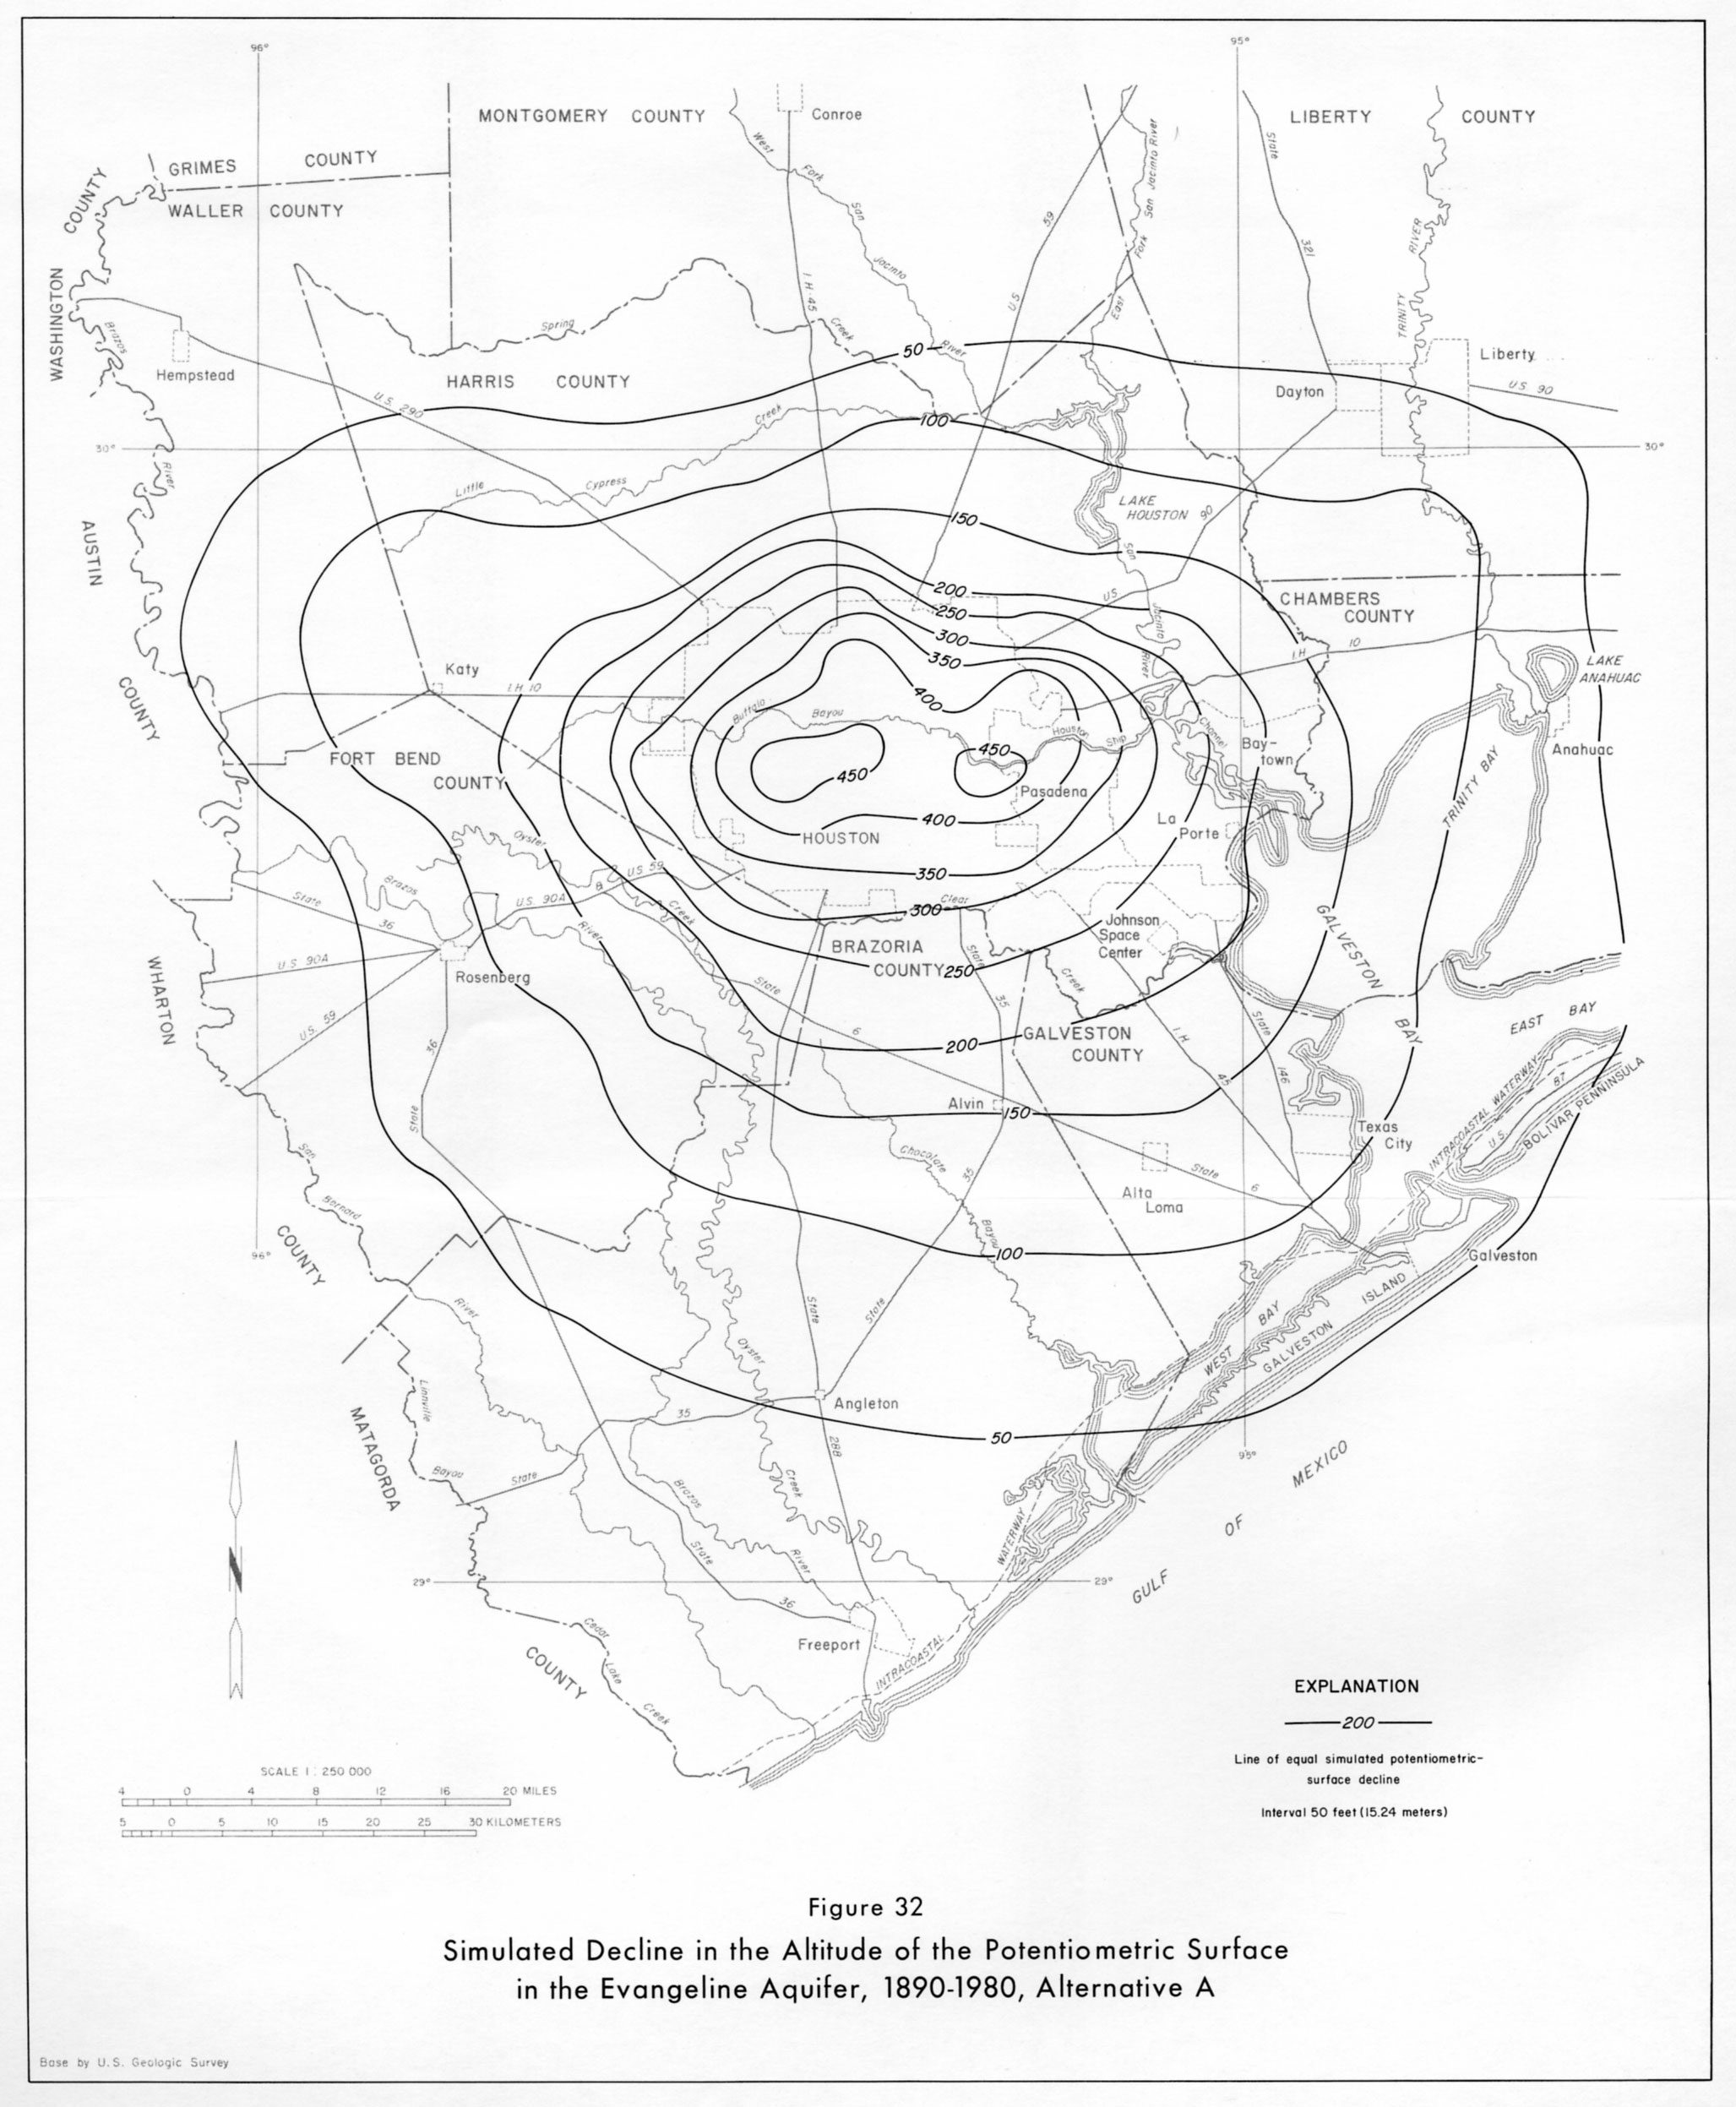
- figure 32 - Simulated Decline in the Altitude of the Potentiometric Surface in the Evangeline Aquifer, 1890-1980, Alternative A
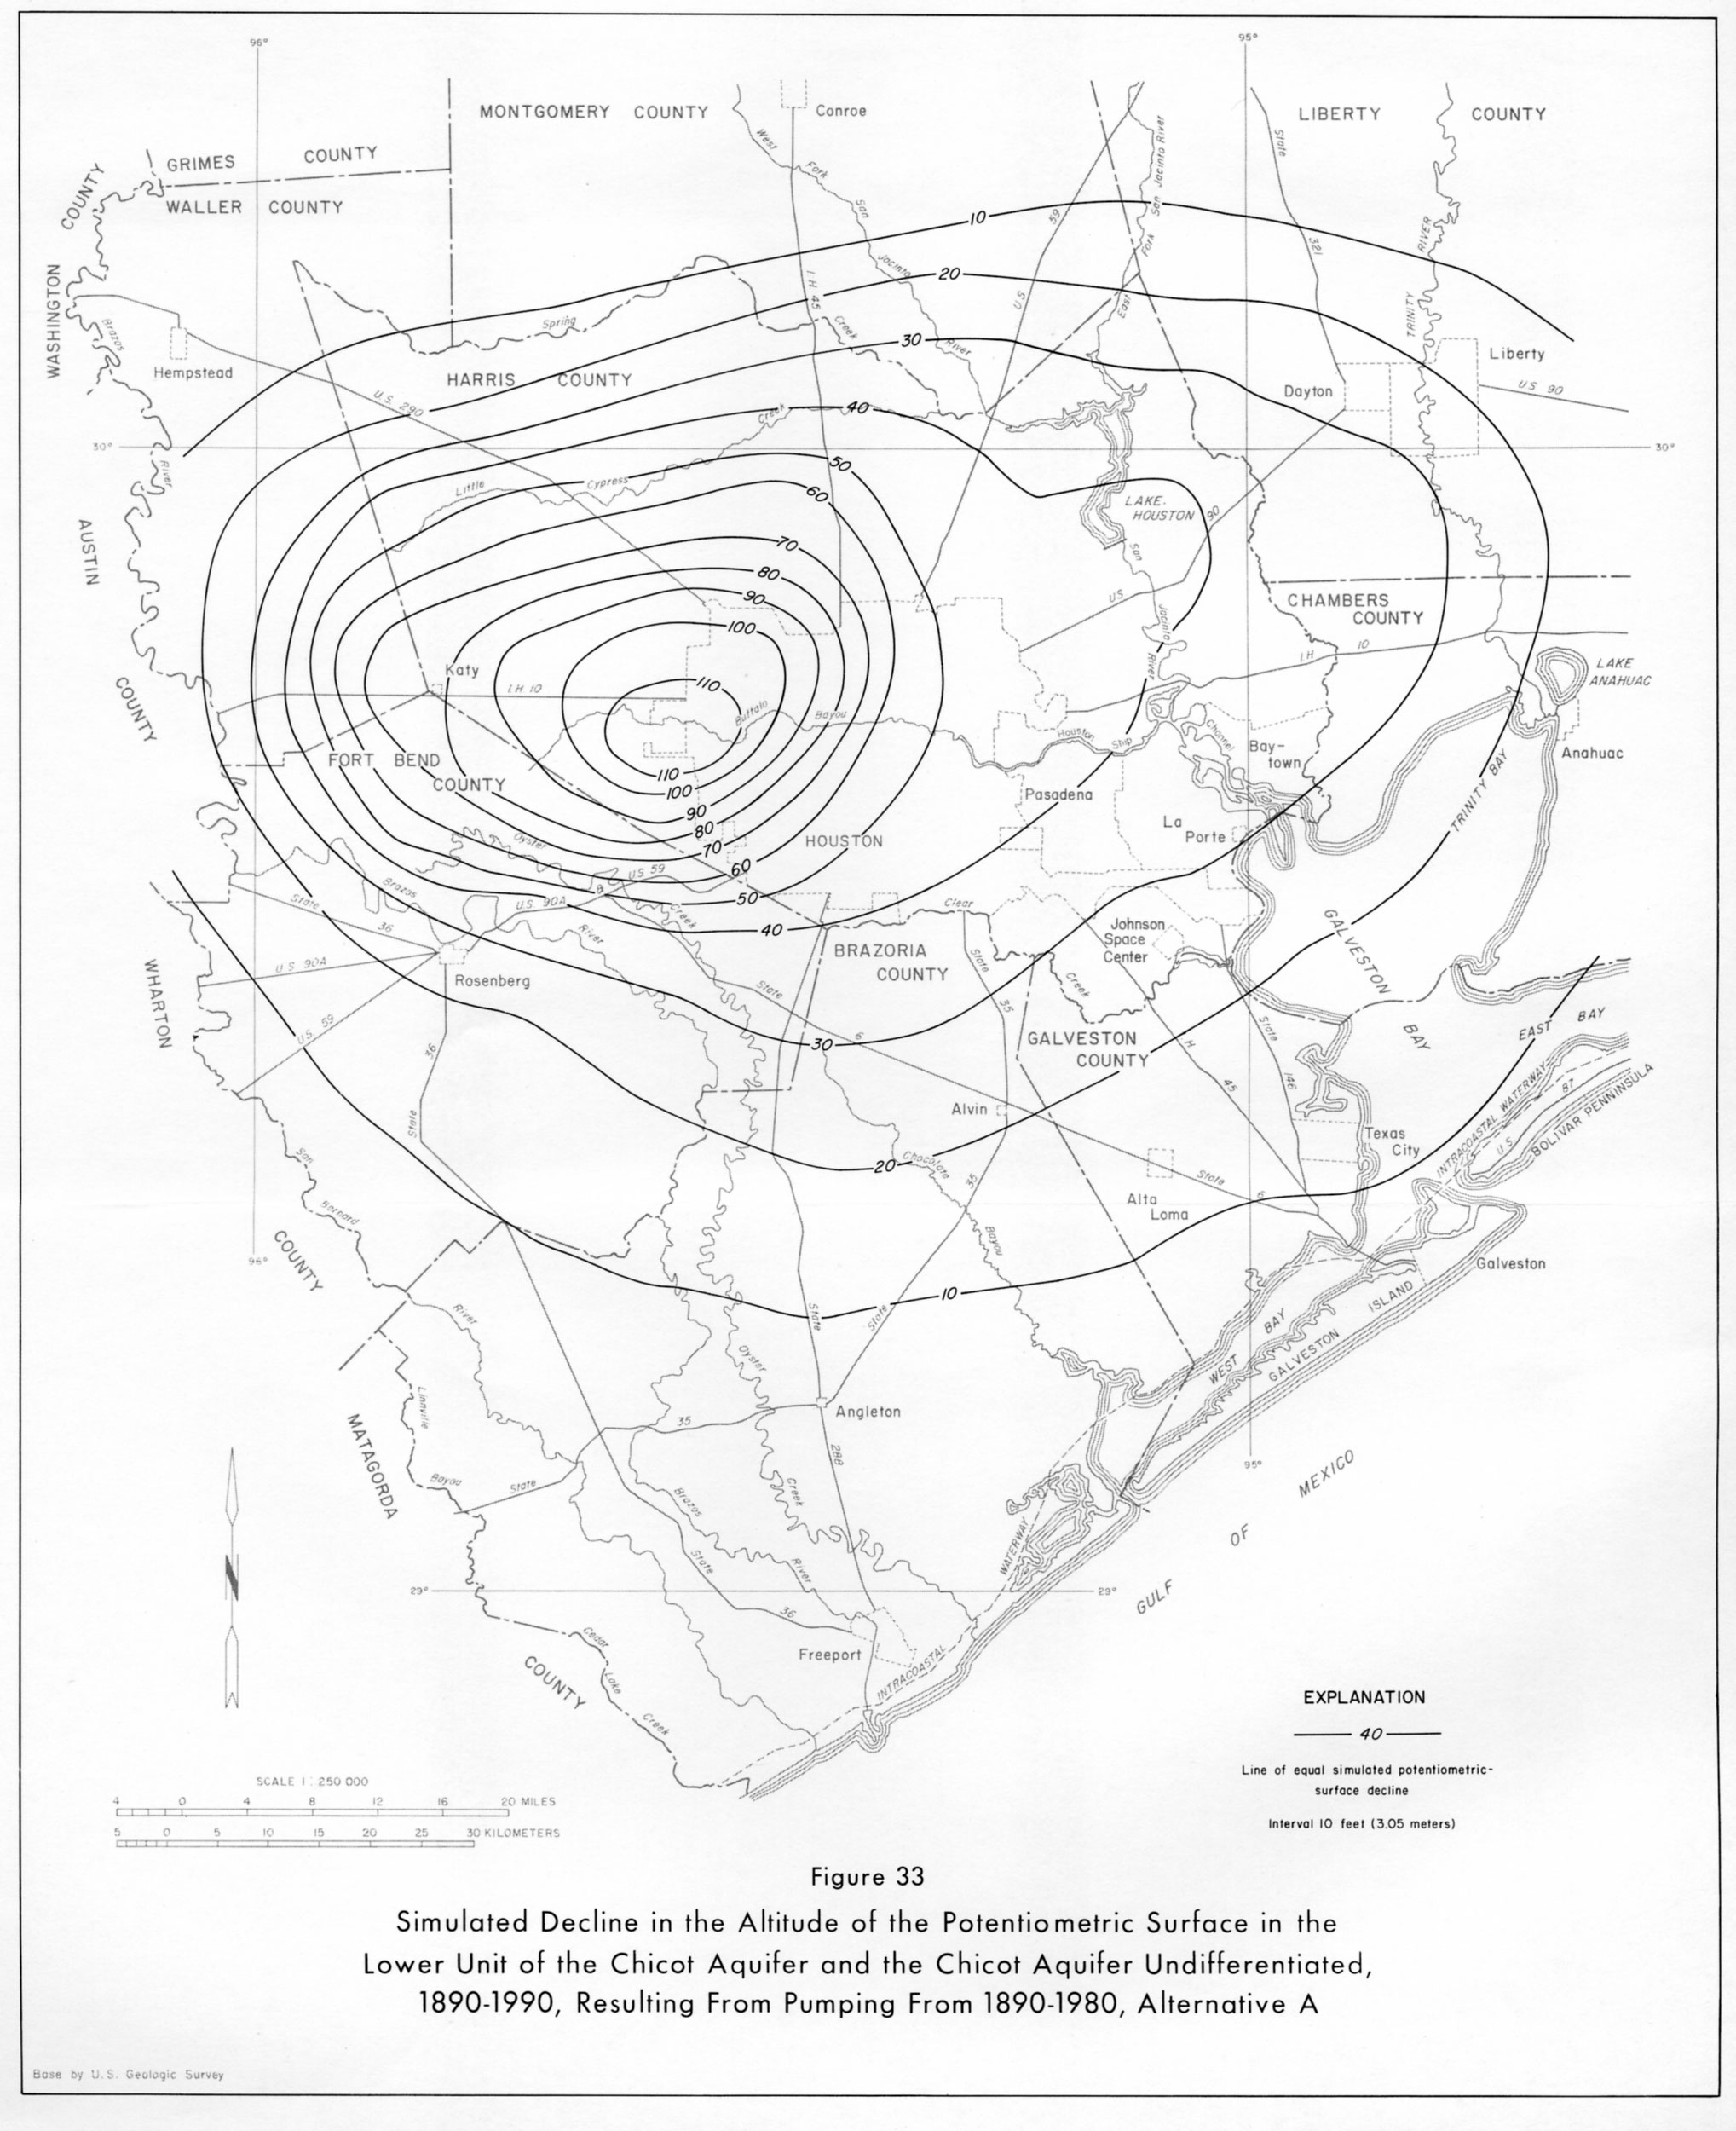
- figure 33 - Simulated Decline in the Altitude of the Potentiometric Surface in the Lower Unit of the Chicot Aquifer and the Chicot Aquifer Undifferentiated, 1890-1990, Resulting From Pumping From 1890-1980, Alternative A
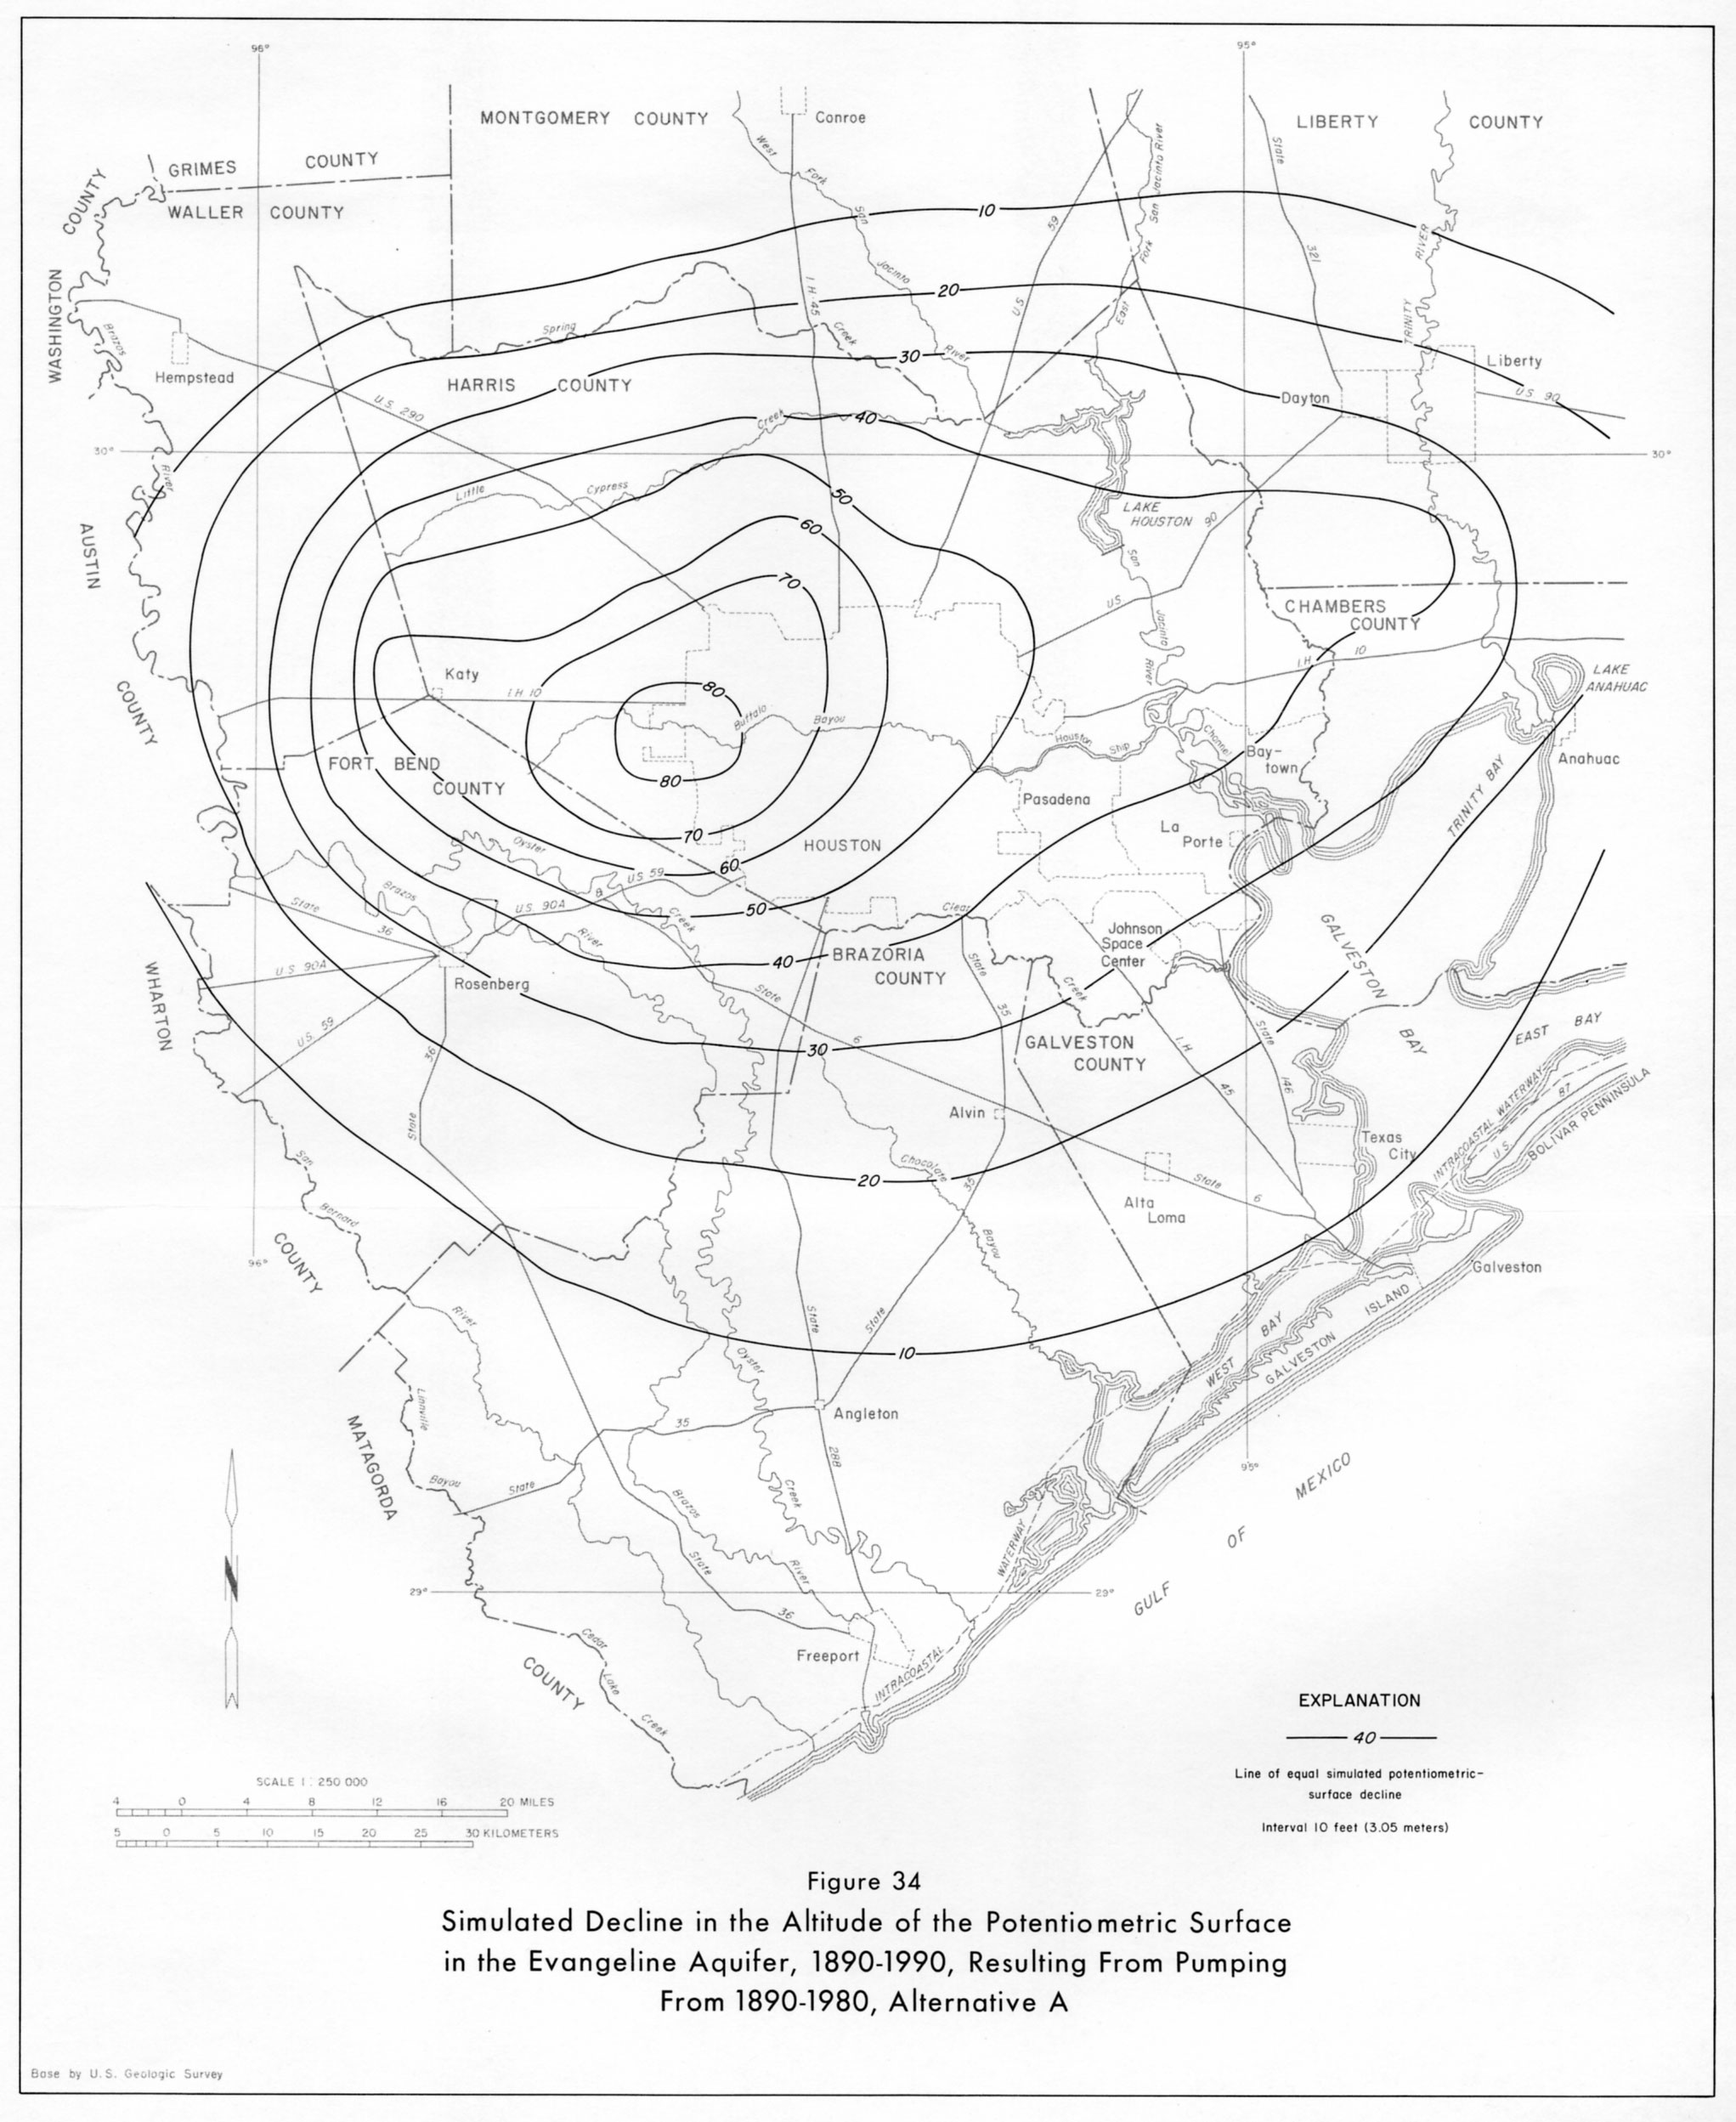
- figure 34 - Simulated Decline in the Altitude of the Potentiometric Surface in the Evangeline Aquifer, 1890-1990, Resulting From Pumping From 1890-1980, Alternative A
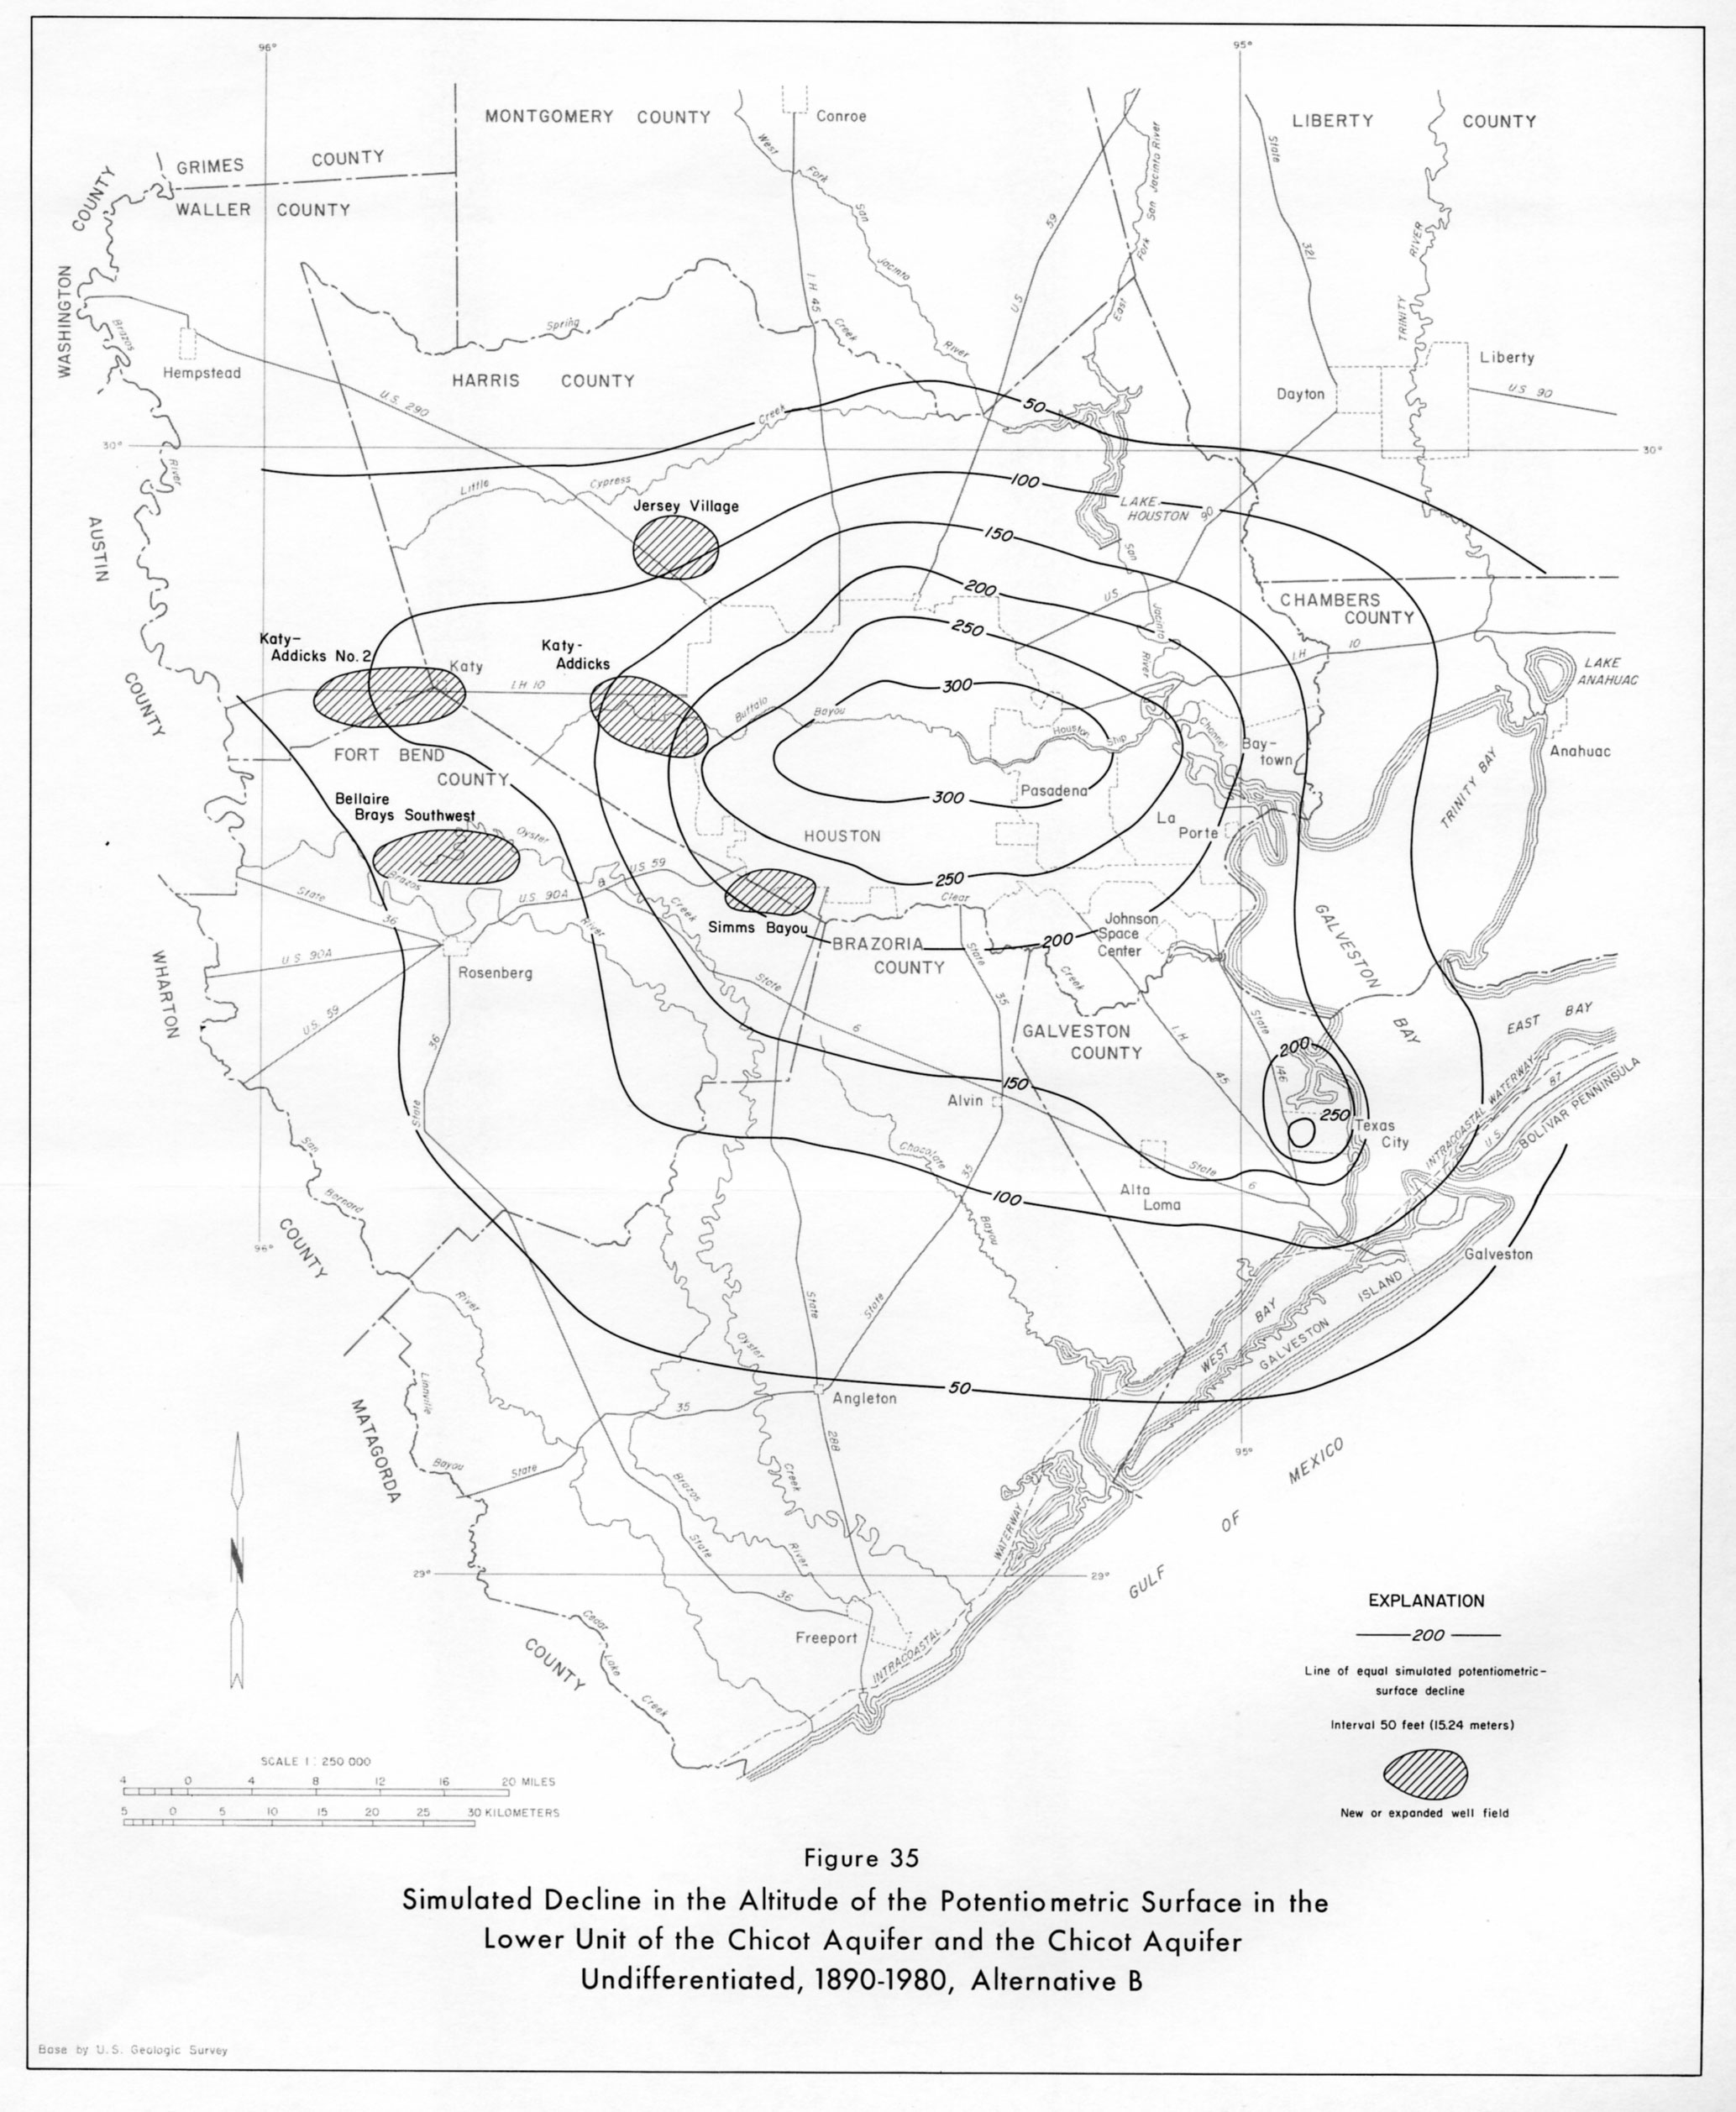
- figure 35 - Simulated Decline in the Altitude of the Potentiometric Surface in the Lower Unit of the Chicot Aquifer and the Chicot Aquifer Undifferentiated, 1890-1980, Alternative B
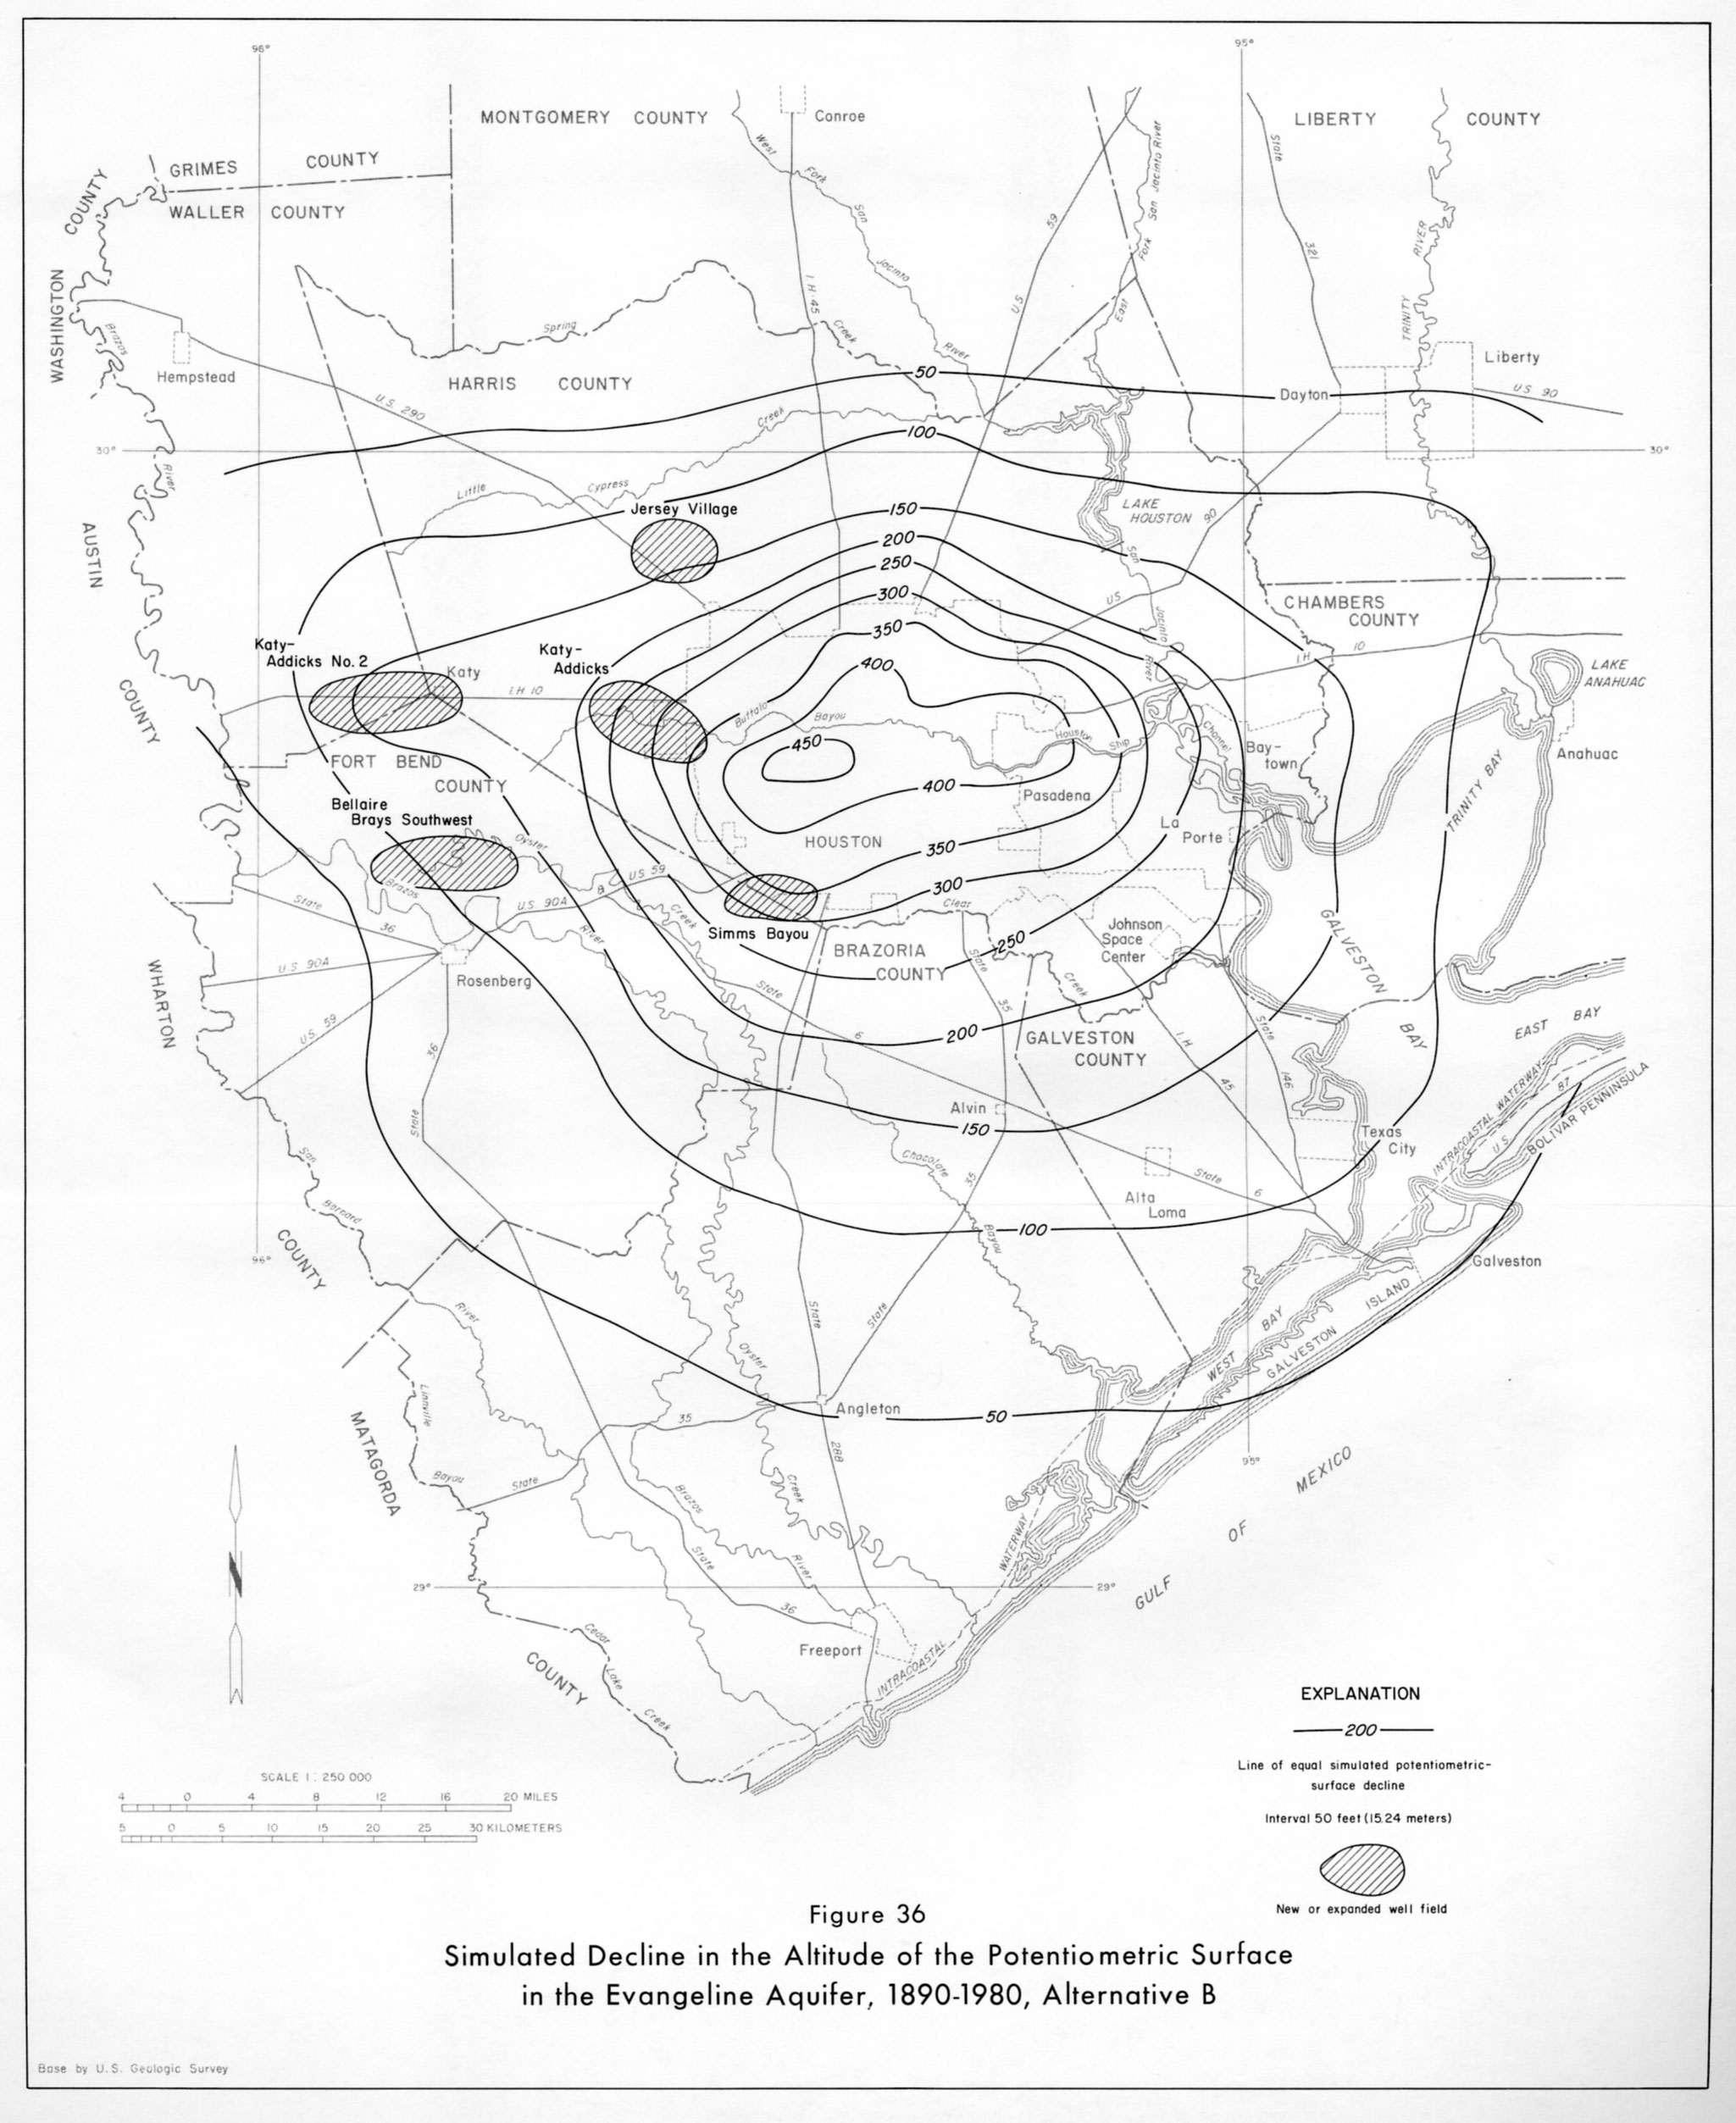
- figure 36 - Simulated Decline in the Altitude of the Potentiometric Surface in the Evangeline Aquifer, 1890-1980, Alternative B
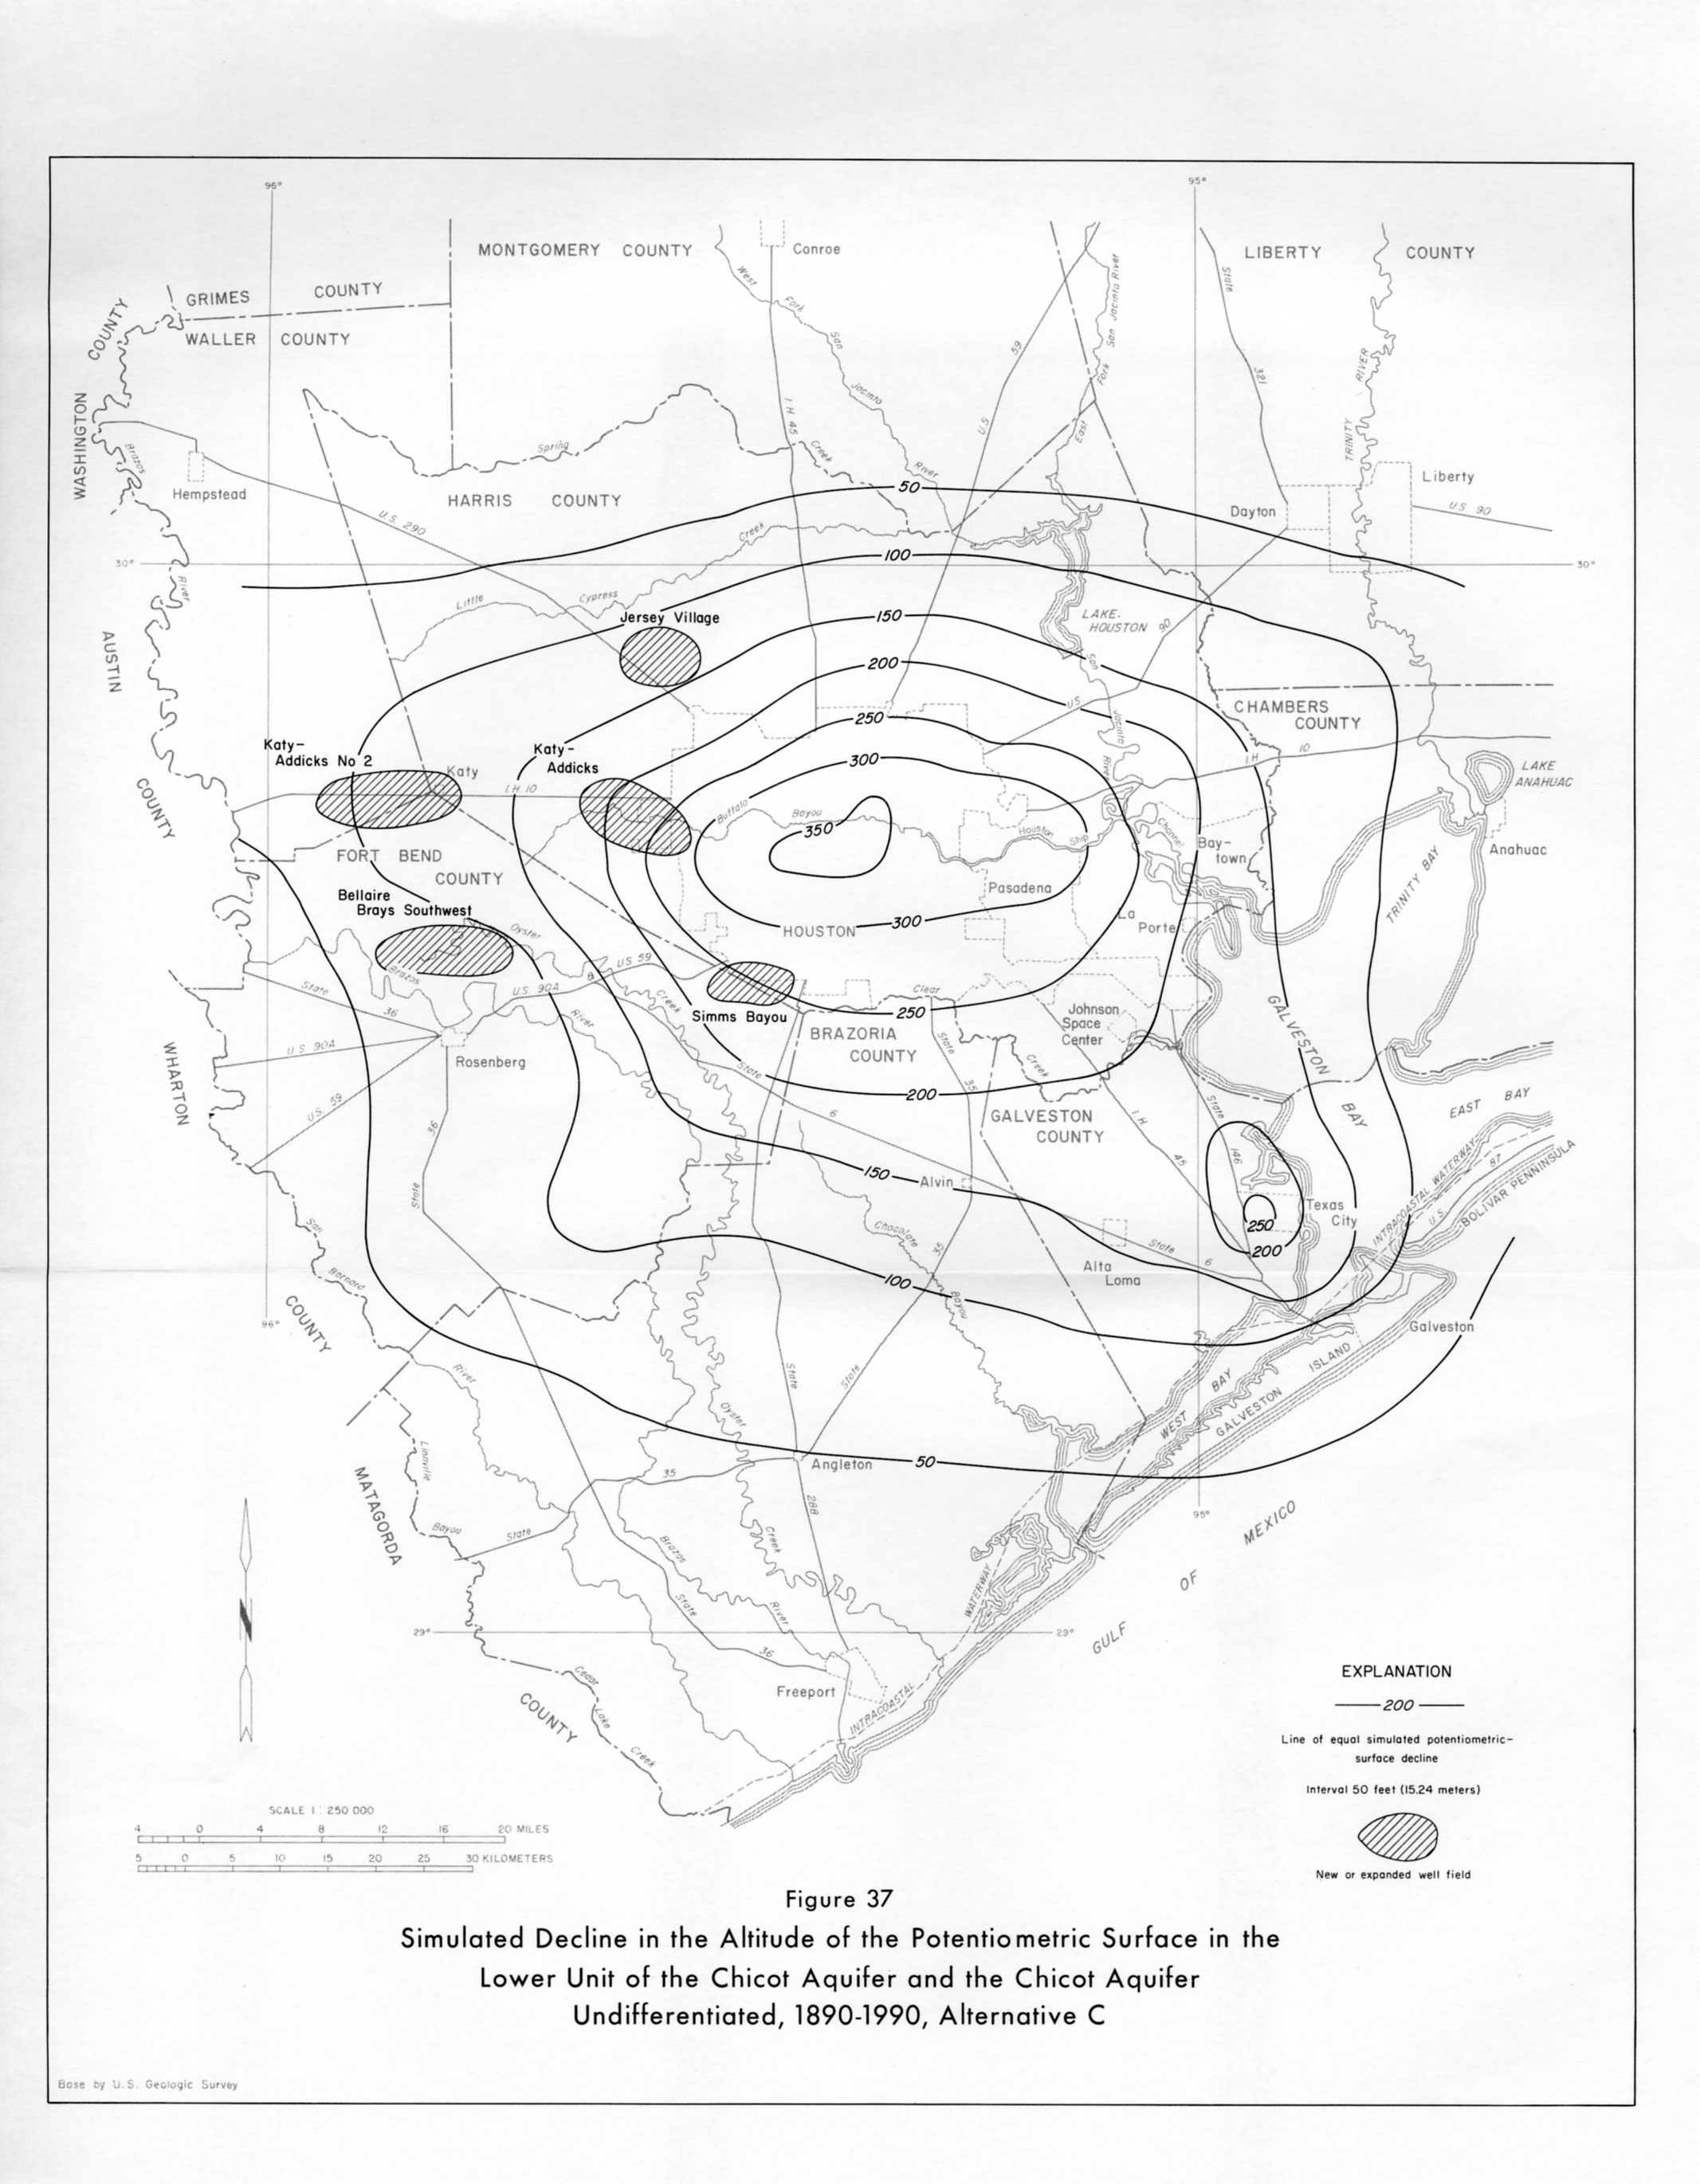
- figure 37 - Simulated Decline in the Altitude of the Potentiometric Surface in the Lower Unit of the Chicot Aquifer and the Chicot Aquifer Undifferentiated, 1890-1990, Alternative C
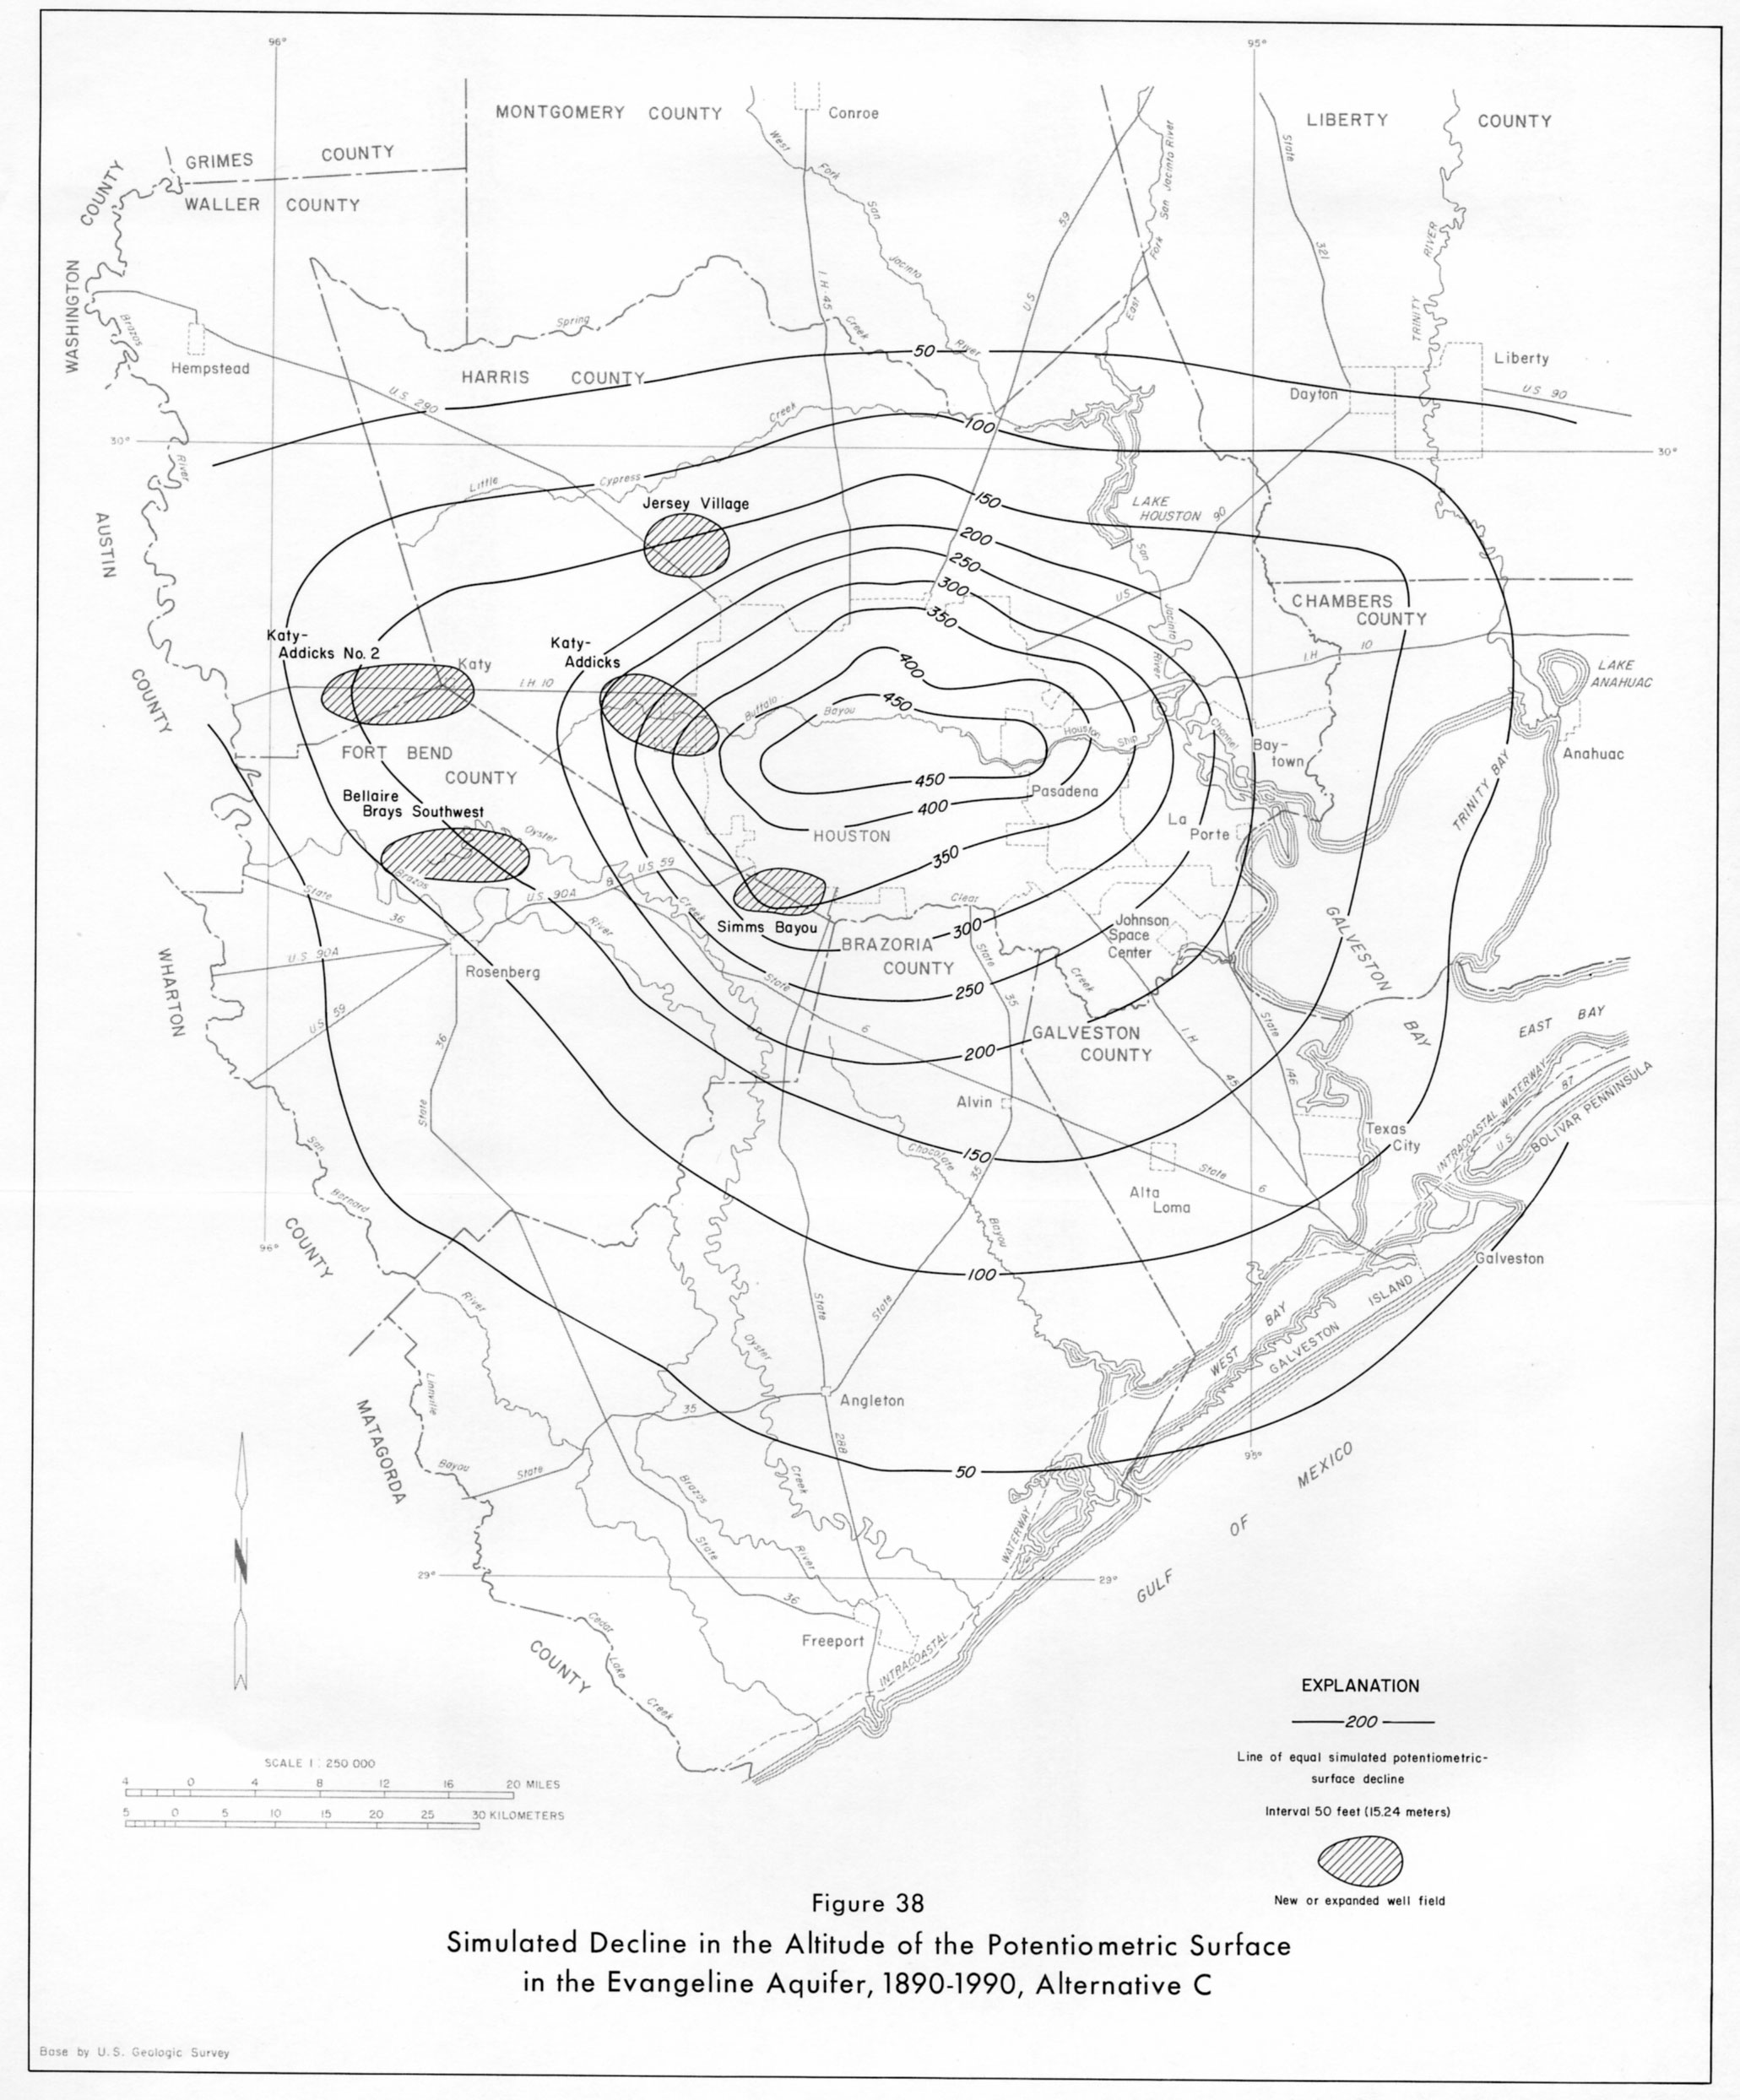
- figure 38 - Simulated Decline in the Altitude of the Potentiometric Surface in the Evangeline Aquifer, 1890-1990, Alternative C
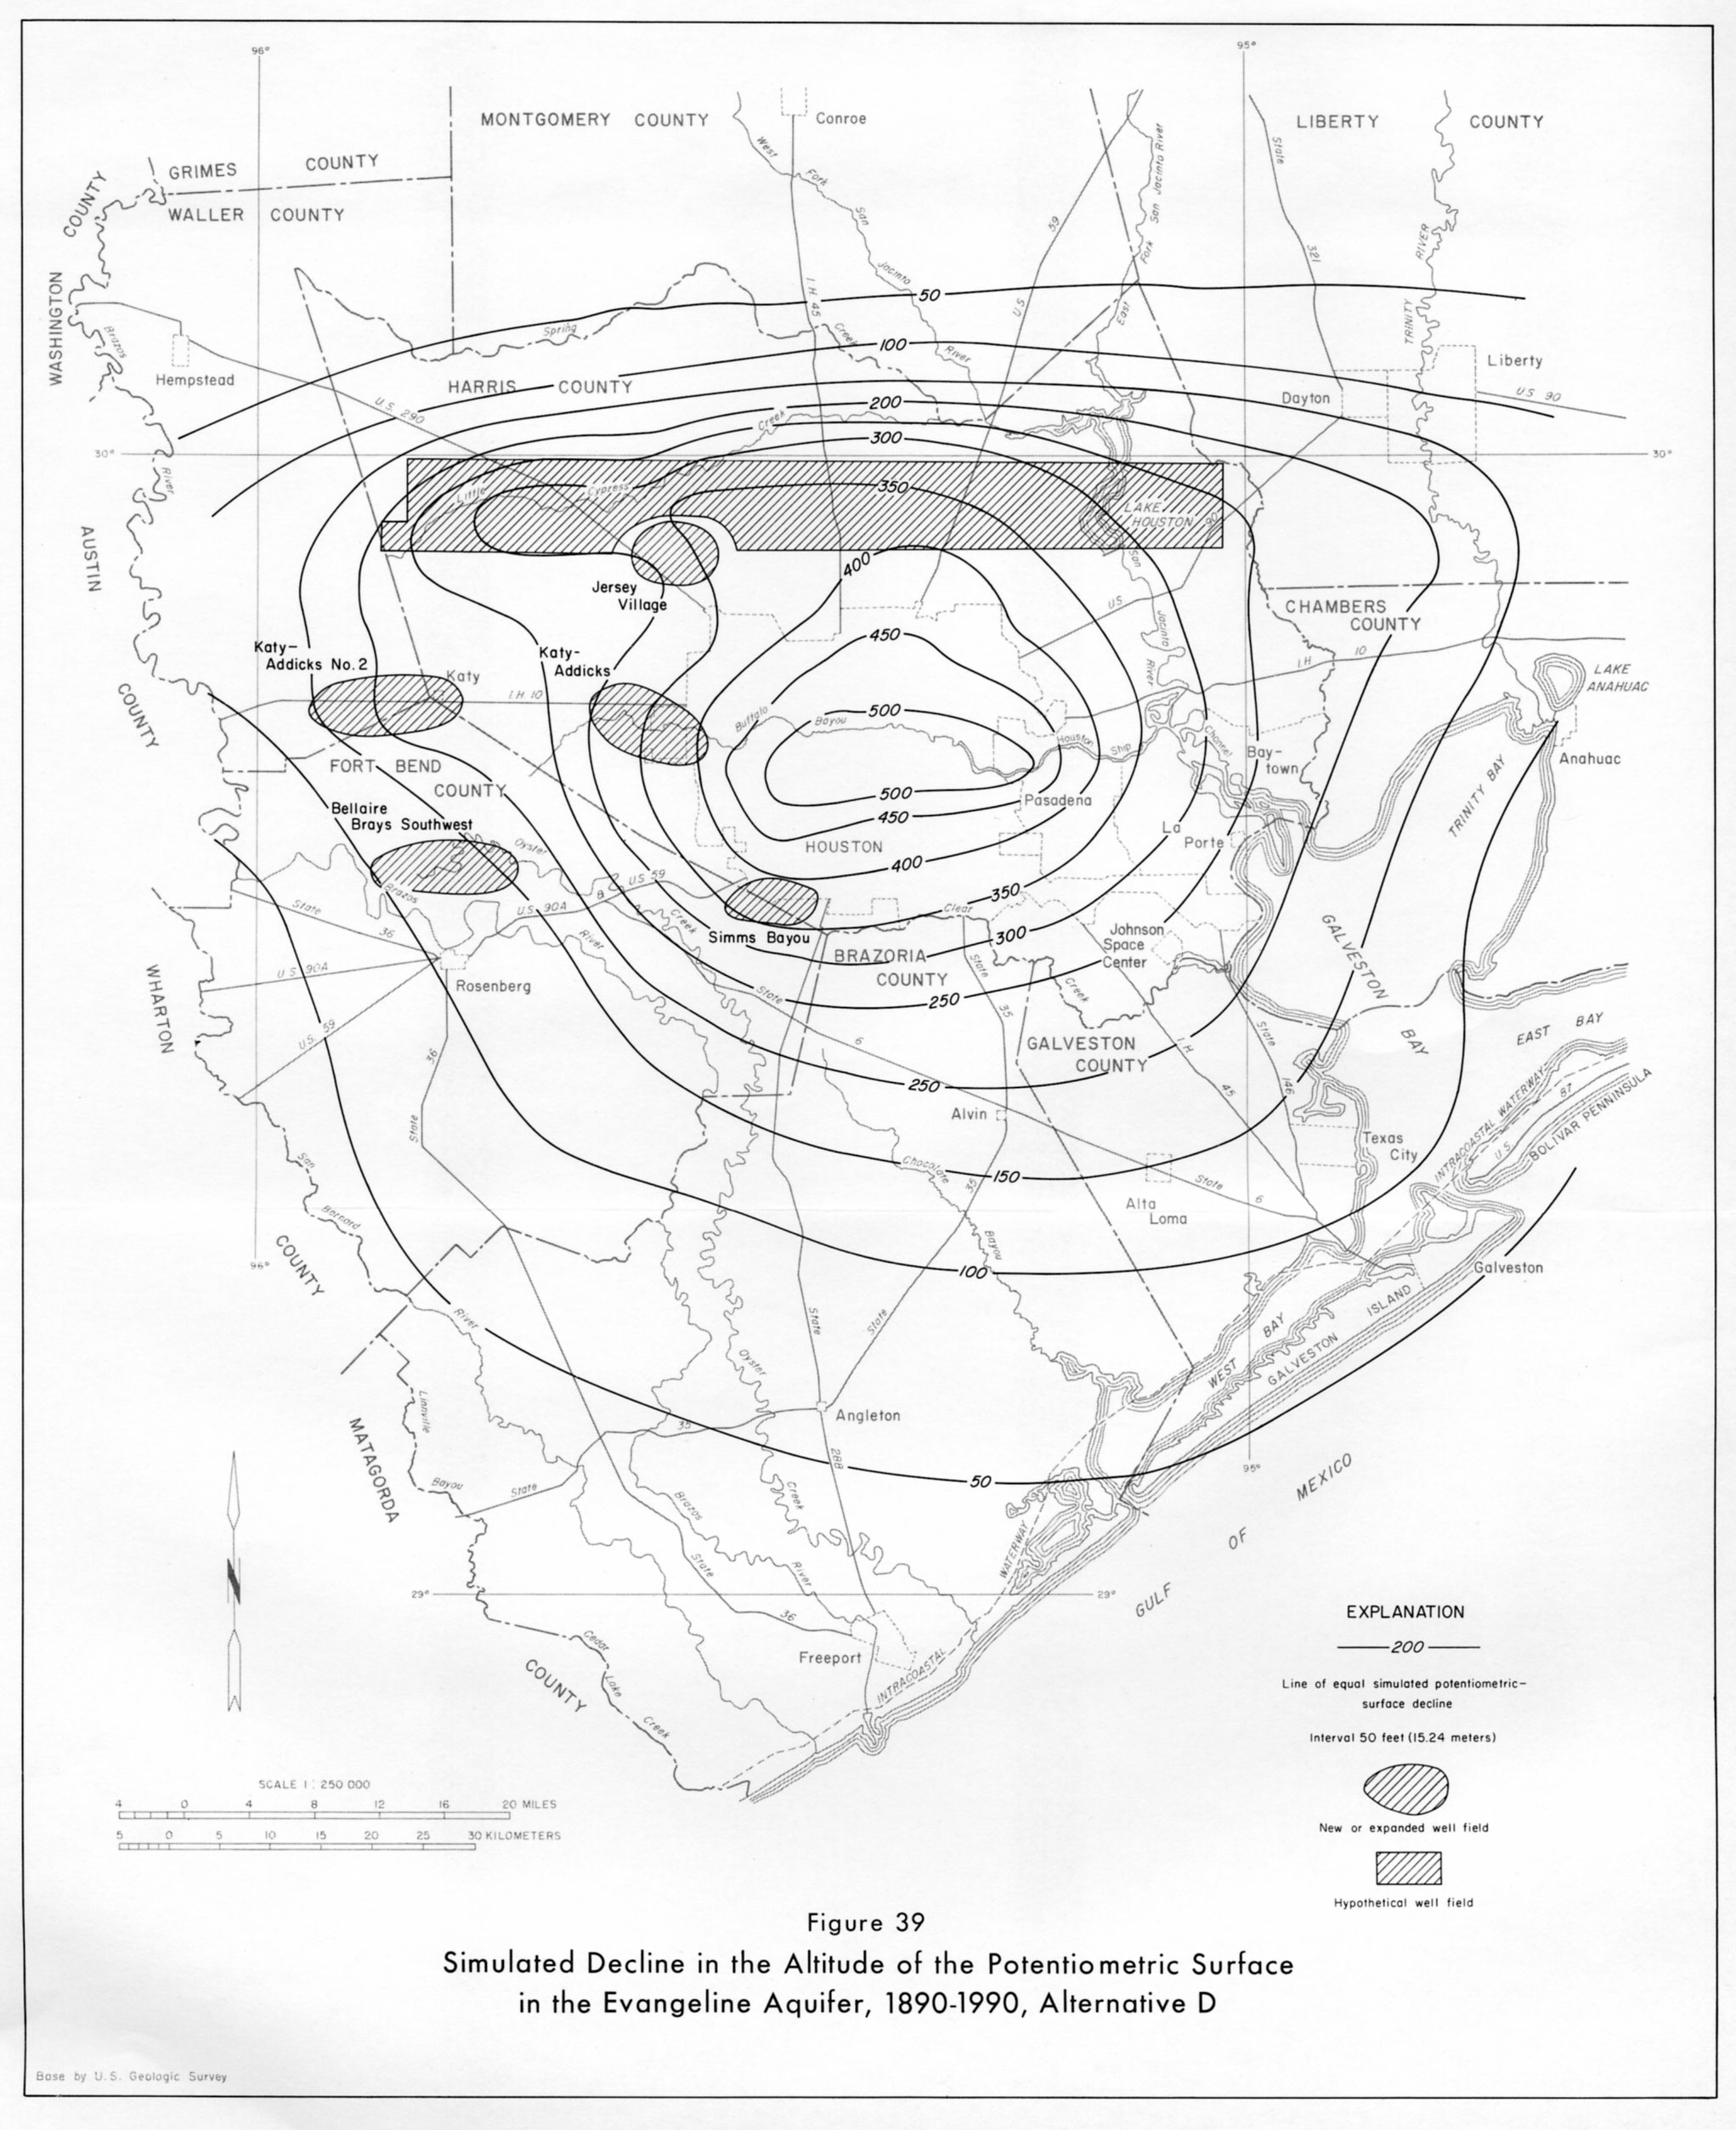
- figure 39 - Simulated Decline in the Altitude of the Potentiometric Surface in the Evangeline Aquifer, 1890-1990, Alternative D
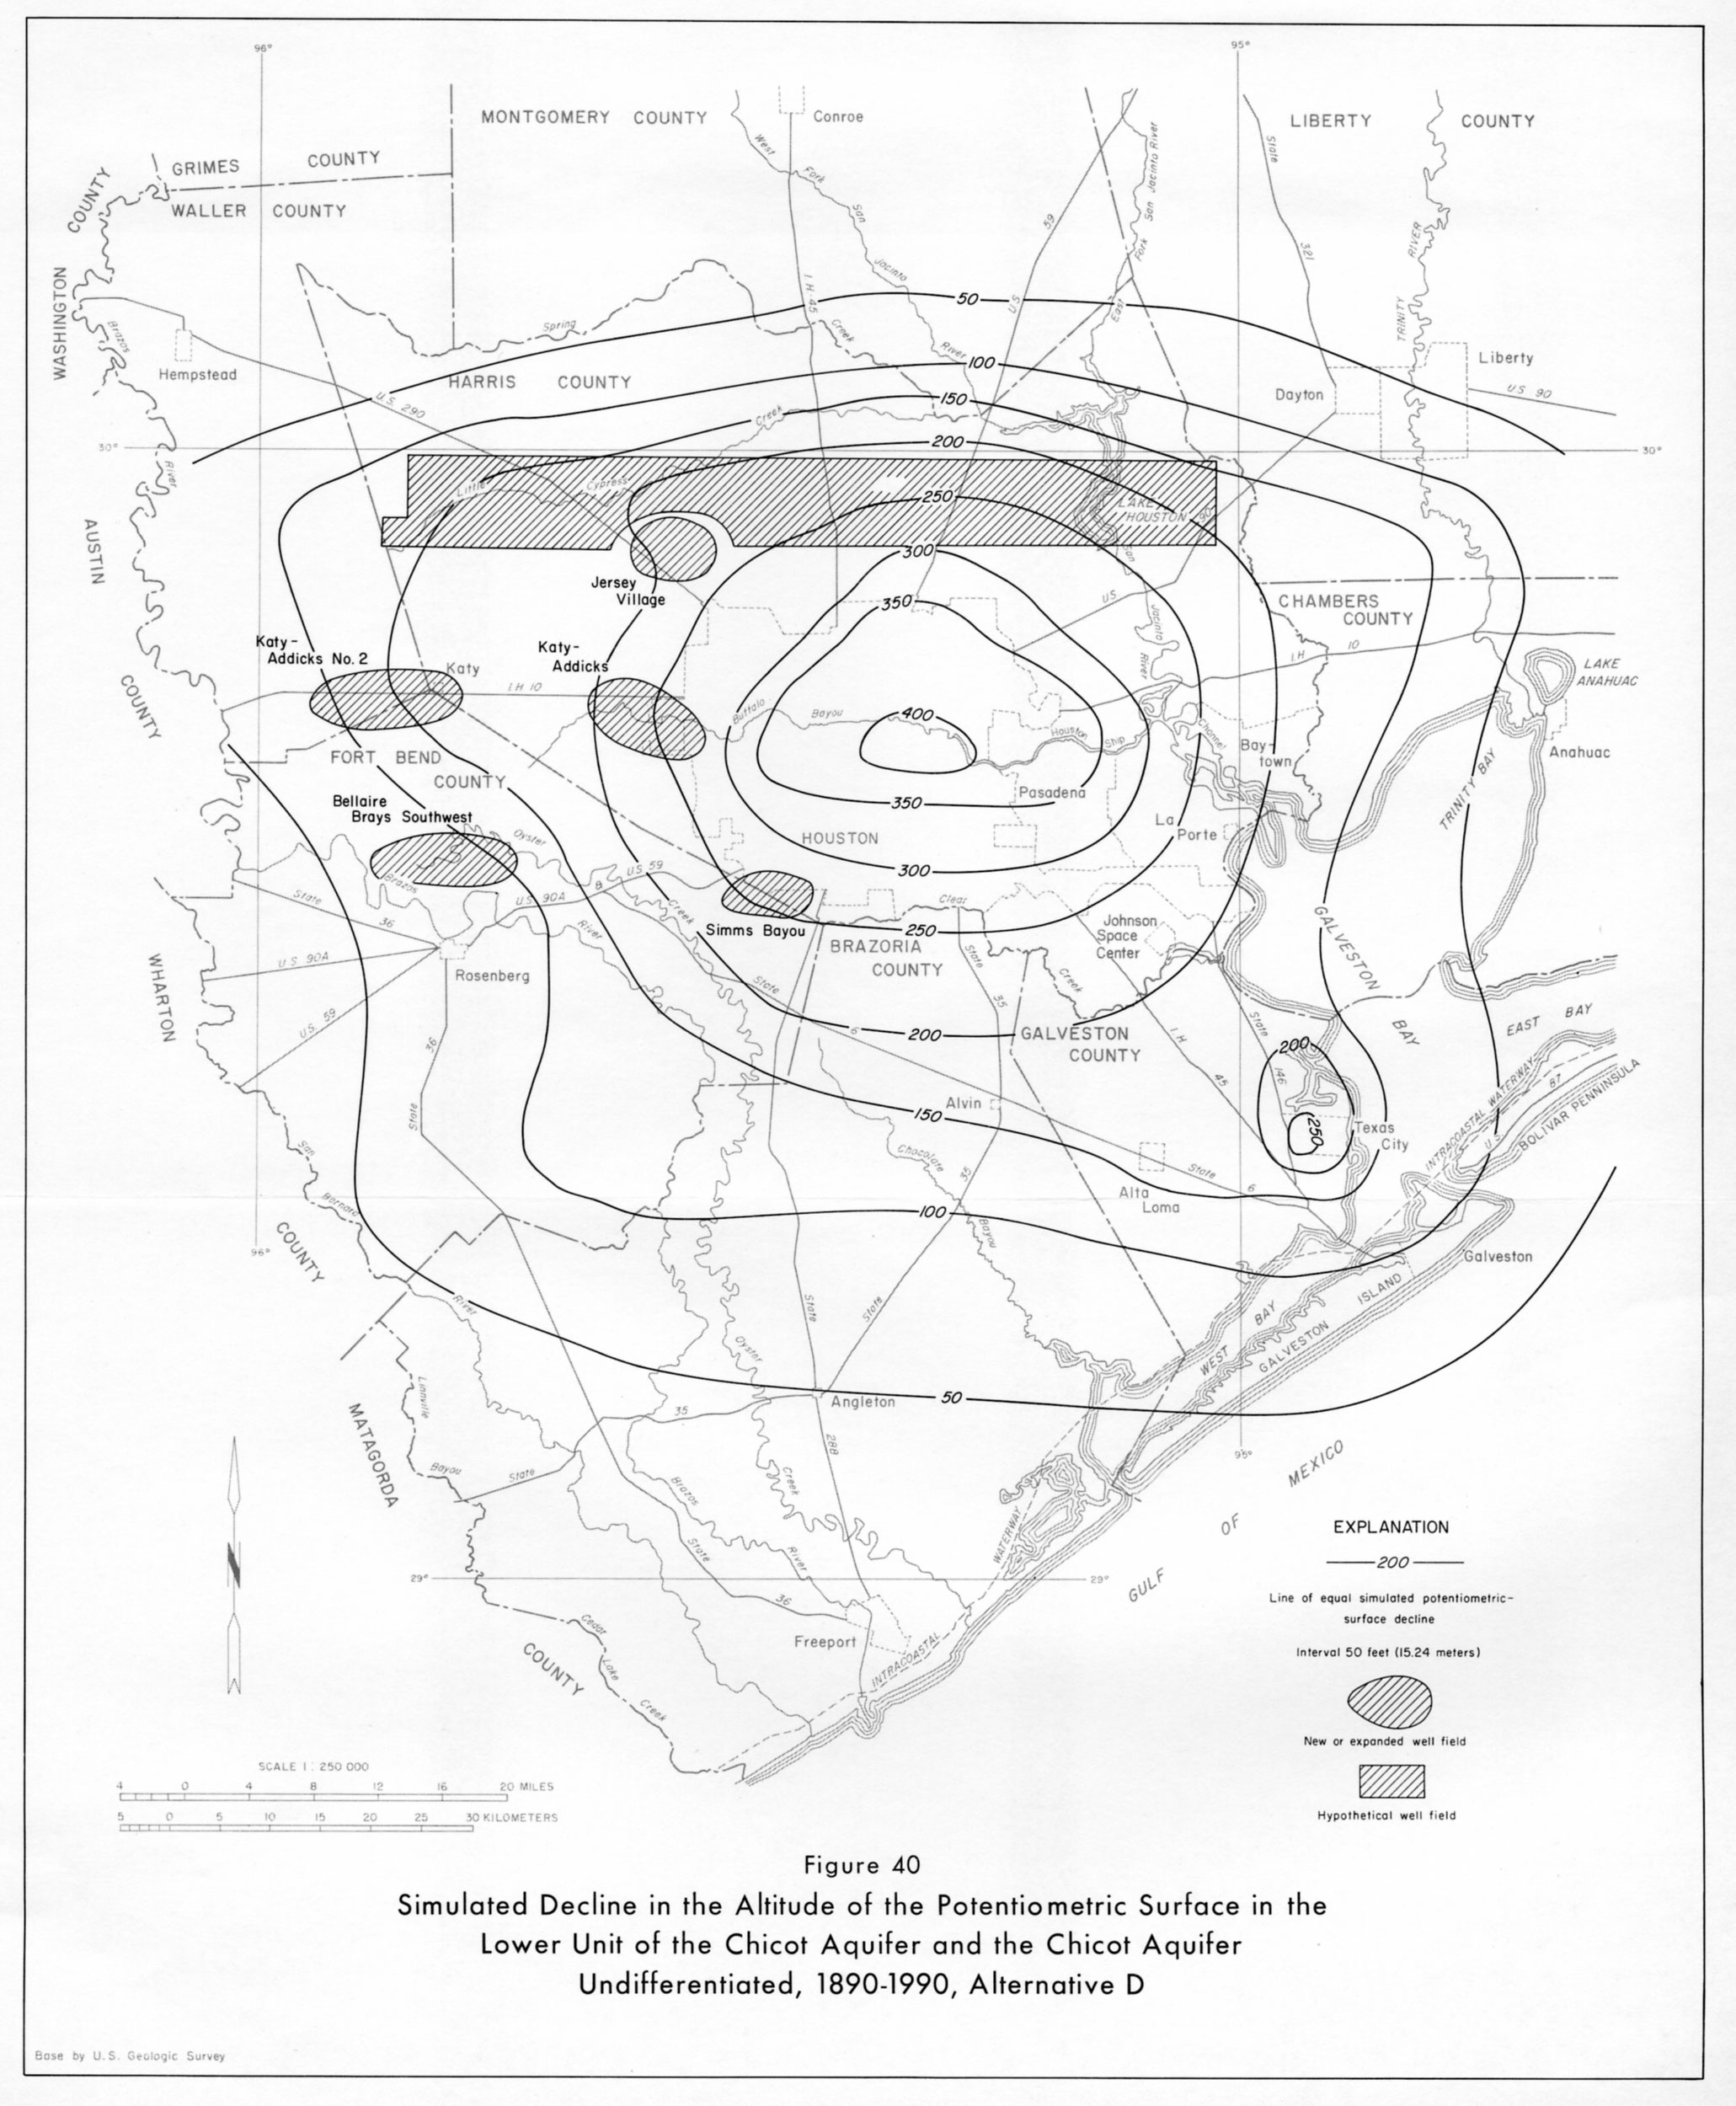
- figure 40 - Simulated Decline in the Altitude of the Potentiometric Surface in the Lower Unit of the Chicot Aquifer and the Chicot Aquifer Undifferentiated, 1890-1990, Alternative D